NGO
Another Way (Stichting Bakens Verzet), 1018 AM
01. E-course : Diploma
in Integrated Development (Dip. Int.Dev.)
Edition
02: 10 November, 2010
![]()
Study points
: 05 points out of 18
Minimum study
time : 125 hours out of 504
The study
points are awarded upon passing the consolidated exam for
Section C : The Model.
[Study points 03
out of 18]
[Minimum study time: 85 hours
out of 504]
The study
points are awarded upon passing the consolidated exam for
Section C : The Model.
Sect. 3 : Costs and benefits
analysis.
[17 hours ]
01. Introduction. (02 hours)
02. The investments made.(02 hours)
03. Detailed results. (02 hours)
04. Efficiency and effectiveness. (02 hours)
05. Management costs.(02 hours)
06. Costs and benefits analysis :
introduction. (02 hours)
07. Costs and benefits analysis : details. (02
hours)
08. Kyoto Treaty : analysis possibilities finance. (Additional)
Section 3 report: (03 hours).
Sect. 3 : Costs and benefits
analysis.
[17 hours ]
07. Costs and benefits
analysis : details. (02 hours)
Refer to parts
01. General introduction
and 06.Analysis of costs and
benefits - introduction of this section.
Consult the Excel file showing the detailed calculation of the
costs and benefits of a typical integrated development project.
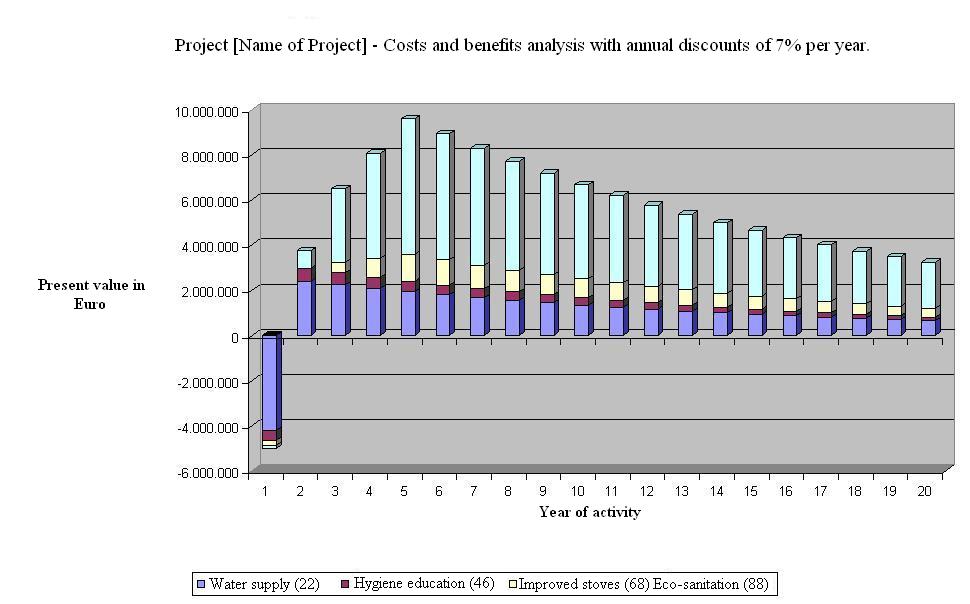
Summary (in €) of costs and benefits
following a traditional method of calculation.
Total investment Euro
5.000.000
Present value of the
investments over 20 years, net of operation and maintenance costs, all
discounted at the rate of 7% a year.
Year activity Net result Annual
benefit factor
01 - 5.000.000 -01.00
02 3.742.767 00.75
03 6.493.678 01.30
04 8.075.785 01.62
05 9.604.568 01.92
06 8.932.251 01.79
07 8.306.992 01.66
08 7.722.523 01.54
09 7.184.717 01.44
10 6.681.788 01.34
12 6.214.062 01.24
12 5.778.753 01.16
13 5.374.543 01.08
14 4.997.884 01.00
15 4.684.314 00.93
16 4.322.942 00.86
17 4.020.330 00.80
18 3.739.015 00.75
19 3.447.180 00.70
20 3.233.771 00.65
Accumulative total 107.551.863 21.53 (20 years)
[Accumulative total 61.745.069 12.35
(10 years)
Click to see the above table presented in graphic form.
The cost-benefit ratios over 20 years, discounted at the rate of 7% per
year are :
Drinking water
05,09
Hygiene
13,20
Stoves 60,88
Eco-sanitation and mills 494,20
1. Opinion.
Provide a
one-page opinion on these results..
2. Opinion.
The drinking
water sector has been strongly «penalised » because of the
’attribution to it of 84,34 % of
the «common costs». On oine page, propose improvements you would bring
to the method for the calculation of the
costs and benefits..
3. Research.
What is the
relationship between the result produced for drinking water supply (factor
05,09) and those produced for traditional drinking water supply projects in
your chosen area (otherwise, in your country) ? Explain the relationship
on one page.
4. Research.
The
«break-even » point in the drinking water sector is reached towards
the end of the fifth year of operation, and factor two in the first part of the
eighth year. At the end of the tenth year the result is a little less than 3
(2,90). Discuss the acceptability of these figures with operators in the
drinking water sector in your project area. Make a one-page report of their
conclusions. Bear in mind that integrated development projects are truly
sustainable and provide for full
replacement of capital items at
each 20 year cycle.
5. Opinion.
The higher
the level of financing of an activity
within the framework of the local money systems set up in integrated
development projects the more “incredible” their financial results. On one page
try to link this fact to the causes of financial leakage analysed in section 1analysis
of the causes of poverty of the first block poverty
and the quality of lfe and in basic concepts : more detail of section 3 the
financial structures of the fourth block the structures to
be created.
◄ Eighth block : Section 3 : Costs and benefits analysis.
◄ Eighth block : Economic aspects.
◄ Main
index for the Diploma in Integrated Development
(Dip. Int. Dev.)
"Money is not the key that opens the gates of the market but the
bolt that bars them."
Gesell, Silvio, The Natural Economic Order, revised English edition,
Peter Owen,
“Poverty is created scarcity”
Wahu Kaara, point 8 of the Global Call to Action Against Poverty, 58th
annual NGO Conference, United Nations,
![]()
This
work is licensed under a Creative Commons
Attribution-Non-commercial-Share Alike 3.0 Licence.