NGO Another Way
(Stichting Bakens Verzet), 1018 AM
SELF-FINANCING,
ECOLOGICAL, SUSTAINABLE, LOCAL INTEGRATED DEVELOPMENT PROJECTS FOR THE WORLD’S
POOR
|
FREE
E-COURSE FOR DIPLOMA IN INTEGRATED DEVELOPMENT |
|||||
Edition 01: 15 November, 2010.
Edition 02 : 08 August, 2011.
Revised and updated version 03 : 11 August,
2011.
Edition 05 : 09 February, 2013.
(VERSION EN FRANÇAIS PAS DISPONIBLE)
Information on
monetary reform :
NEW Capital is debt.
NEW Comments on the IMF (Benes and Kumhof) paper “The
Chicago Plan Revisited”.
DNA of the debt-based economy.
General summary of all papers published.(Revised edition).
How to create stable financial systems in four
complementary steps. (Revised edition).
How to introduce an e-money financed virtual minimum wage
system in New Zealand. (Revised edition) .
How
to introduce a guaranteed minimum income in New Zealand. (Revised edition).
Interest-bearing debt system and its economic impacts.
(Revised edition).
Manifesto of 95 principles of the debt-based economy.
The Manning plan for permanent debt reduction in the national economy.
Missing links between growth, saving, deposits and
GDP.
Savings Myth. (Revised edition).
Unified text of the manifesto of the debt-based
economy.
Using a foreign transactions surcharge (FTS) to manage the
exchange rate.
(The
following items have not been revised. They show the historic development of
the work. )
Financial system mechanics explained for the first time. “The Ripple
Starts Here.”
Short summary of the paper The Ripple Starts Here.
Financial system mechanics: Power-point presentation.
![]()
This
work is licensed under a Creative Commons
Attribution-Non-commercial Share-Alike 3.0 Licence.
HOW TO
INTRODUCE A GUARANTEED MINIMUM INCOME IN
By
Sustento
Institute,
"The
government should create, issue and circulate all the currency and credit
needed to satisfy the spending power of the government and the buying power of
consumers..... The privilege of creating and issuing money is not only the
supreme prerogative of Government, but it is the Government's greatest creative
opportunity. …….The taxpayers will be saved immense sums of interest, discounts
and exchanges. The financing of all public enterprises, the maintenance of
stable government and ordered progress, and the conduct of the Treasury will
become matters of practical administration. …….. Money will cease to be the
master and become the servant of humanity."
[
“Financial
markets have worked hard to create a system that enforces their views: with
free and open capital markets, a small country can be flooded with funds one
moment, only to be charged high interest rates - or cut off completely - soon
thereafter. In such circumstances, small countries seemingly have no choice:
financial markets' diktat on austerity, lest they be punished by withdrawal of
financing”.
[Joseph E. Stiglitz “Taming Finance in an Age of Austerity” Published by Project
Syndicate, Monday July 12, 2010]
Key
Words: current account deficit, debt, debt model, debt growth, deposit
interest, domestic debt, domestic credit, equity in society, exponential debt
growth, Financial Transactions Surcharge, Financial Transactions Tax, Fisher
equation, foreign debt, FTS, FTT, GMI, guaranteed minimum income, inflation,
revised Fisher Equation, savings, structural debt growth, systemic debt growth,
systemic inflation, unearned income, UBI, universal basic income.
ACKNOWLEDGEMENTS.
The
author gratefully acknowledges the support of Raf Manji and the Sustento
Institute for their encouragement and advice; and to Terry
Manning and the NGO Bakens Verzet whose editing
and constructive critique have been crucial as the paper has evolved over time.
CONTENTS:
01.
EXECUTIVE SUMMARY.
02.
THE ECONOMIC DILEMMA.
03. THE GUARANTEED MINIMUM
INCOME GMI PLAN.
04. THE GMI PLAN DETAILS.
05. CONCLUSION.
06. APPENDIX 1 :THEORETICAL
BACKGROUND.
07. APPENDIX 2: THEORETICAL
SUPPORT FOR THE PROPOSAL.
08.
APPENDIX 3 CALCULATIONS FOR TABLE 4.
09.
BIBLIOGRAPHY.
01. EXECUTIVE SUMMARY.
The main dilemma faced by today’s economic policy makers is that the
price-based financial system they have been using has run out of room to
manoeuvre. It is no longer possible either to substantially increase interest
rates to combat inflation or to reduce them to stimulate “economic growth”.
This paper offers a
practical plan to resolve the world’s problem of exponential debt growth and to
control inflation. The plans are based
on a revision of the well-known Fisher Equation of exchange enabling it to take
account of interest-bearing debt. They are designed to ensure that no low or
middle income group in the community is
worse off than it is now.
The plan involves
introducing a guaranteed minimum income (GMI) for each person in the country to
replace the existing welfare system. The GMI can be funded on an income-positive
basis by phasing out existing welfare transfer payments, by
realigning existing tax thresholds and by introducing a wealth tax of 1% of all
net assets. This paper shows that a fair
result is produced using a flat tax of 41.5% on all earned income.
GMI income is
itself tax-free. For most people, the income tax they pay on their total income
will be less than it is now. A flat tax of greater than 41.5% would tend to
weight the GMI too much in favour of families with children and those on low
incomes. The proposed wealth tax transfers funds from the investment sector to
the productive sector as is already done in
The GMI also involves the
injection of new electronic cash or E-notes to stimulate economic growth. The
new electronic currency will be created debt-free by the Central Bank. To
reduce the possibility of future inflation some of the E-note injection will be
distributed in the form of grants to businesses. In this paper a figure of 20%
has been used arbitrarily for the capital grant.
The electronic
currency injection will have to continue indefinitely because it is built into
the GMI structure. Once full employment is reached the growth stimulus might
have to be sterilised through savings programs to avoid demand-pull inflation,
such as, in
The modest
debt-free injection of purchasing power using E-notes will increase the demand
for labour, providing strong economic growth. The labour supply will be
provided from existing spare unemployed capacity and from new labour resources made
available by the removal of existing benefit-related work constraints. Prices should not change because increases in
production costs tend to be avoided. The plan is expansive because firms can
increase their production in the normal way subject to human and physical
resource limitations and consumption demand.
A
supplementary reserve ratio will need to be introduced to the banking system over
and above the existing Basel III capital adequacy requirements. It will need to
be large enough to sterilise the new E-note deposits in the banking system, and
also to support progressive lowering of the OCR (Official Cash Rate). The banking system will apply quantity
controls on debt and money instead of using price controls through interest
rates as it does now. As the OCR is
reduced towards zero percent, the existing systemic inflation in the economy
caused by the payment of unearned income in the form of interest on bank deposits will in turn drop towards zero.
Since
the plan can be made practically inflation free it will not measurably increase
the cost of exports but it does propose to introduce a variable Foreign
Transfer Surcharge or FTS starting at 10%. This would allow the
On the
basis of the preliminary debt model calculations for
Until
now, prices P in the revised Fisher equation (Manning, 2009) have been
maintained at the expense of output Q, as firms have sought to maintain or
improve profits by cost cutting and shedding labour. Some firms may soon have
to begin reducing prices P to maintain output Q at functional levels and still
clear their market 01.
The plan
offered in this paper provides an incentive for those receiving only their GMI
to engage in economically productive activity.
It is also deliberately skewed in favour of families with children and
those on low incomes.
The plan offers a practical and stable route toward on-going debt
reduction with a very low level of inflation in the economy
01 The change in the speed of circulation Vy
of the circulating debt My in the revised Fisher equation referred
to is primarily structural. Vy tends to decline as the payments
change. Except for secondary effects related to changes in interest rates,
circulating debt My must expand in the debt system if the economy is
to grow.
02. THE ECONOMIC DILEMMA.
The body of work supporting this paper confirms that
a revised Fisher Equation of Exchange 02 and the Fisher Theory of
Interest (Fisher 1930) are sufficient to
explain why debt is expanding exponentially throughout the world and why
orthodox economics has failed to prevent unsustainable debt growth resulting in
boom and bust economic cycles interspersed with downturns and recessions. The
main difference between the revised Fisher Equation presented, which
incorporates the impact of interest-bearing bank debt, and orthodox economics
is that while the revised Fisher Equation is based on managing the quantity of
debt, orthodox economics is focused on the price of debt.
Both approaches eventually require the quantity
of debt to be regulated. The revised Fisher Equation shows that when the price
of debt, expressed as the average interest rate paid on bank deposits, is used
as a regulator, an exponentially growing pool of unearned income is created.
That pool of unearned income has to be funded by inflation in the productive
sector because unearned income, by definition, produces nothing itself. As long
as that pool of unearned income was relatively small compared with economic
output expressed as Gross Domestic Product GDP the interest cost could be
funded from increased productivity and economic growth. The result was an ongoing shift in wealth
from the productive sector to the investment sector. As long as that shift was corrected through
socially acceptable income redistribution, the system remained relatively stable
03. As the world economy has
become ever more reliant on interest-bearing debt instead of cash transactions
the impact of unearned income on debt levels has increased exponentially.
02 Detailed in
Appendices 1 and 2.
03 In practice, in
many Western Countries like the
Exponential “growth” curves are inexorable. What started as a relatively small effect has
rapidly become unsustainable throughout the world. In
Excess bubble debt is produced by failure by the
banking sector to properly align demand for credit with the productive capacity
of the economy. It arises in
From the March 2009 year through the March 2011
year there is little evidence of real expansion of
The dilemma faced by economic policy makers is
that the price-based financial system has run out of manoeuvring room. It is no
longer possible either to substantially increase interest rates to combat
inflation or for that matter to reduce them to stimulate “growth”. In
During 2011, each 1% extra deposit interest in there has been little recorded growth for
the year ending March 2011 and systemic inflation is still running at about
1.8% on an annual basis before taking the GST increase of 2.5% in October 2010
into account. Meaningful stimulation of the
04. Assuming wage rates increase with inflation
plus productivity growth and there are no changes in indirect taxes.
05. The OCR in
03. THE GUARANTEED MINIMUM INCOME (GMI) PLAN.
This plan proposes to replace most of the
current welfare system with a GMI (Guaranteed Minimum Income).
The GMI stands on its own independent of other
policy changes. The apparent distortions caused by those in employment
receiving both their GMI and their ordinary work incomes can be minimised by
adjusting tax rates and thresholds. The effect of the GMI on the basis of the
preliminary data in Tables 1 to 4 below may be to encourage minor demographic
migration to the provinces where accommodation costs are lower, particularly
among those who are not in the labour force.
a). Existing imbalances and complexities in the
tax system will be corrected by replacing the existing social welfare system
with a guaranteed minimum income, (GMI). The GMI will be paid weekly to all
permanent legal
b). The GMI will be funded from:
(i) Transfer
of existing government welfare payments to the GMI.
(ii) An
annual wealth tax of 1% on all accumulated net wealth.
(iii) A modest Injection of electronic cash
(E-notes) .
(iv) Revision of the tax thresholds and tax
rates for middle and upper income groups.
The wealth tax is designed to improve the
efficiency in the use of the country’s capital base. The GMI as a whole will be
designed to maintain or improve the existing physical incomes of most
households07 . The tax will gradually reverse the historical
accumulation of wealth in the unearned income sector at the cost of the
productive sector caused by the transfer processes inherent in the existing
debt-based financial system.
c). A Foreign Transaction Surcharge (FTS) will
be introduced to minimize the risk of capital flight and manage the foreign
currency exchange rate. The FTS will be deducted automatically through the
banking system and will apply to all foreign exchange transactions from all
sources. The FTS will be applied on a tax-neutral basis, with receipts from the
surcharge being used to reduce domestic taxation (such as GST). The FTS could
initially be set at 10% that is, 10 times the level of the proposed wealth tax.
That would be high enough to dissuade capital flight but not enough to have a
serious impact on the exchange rate. It can subsequently be adjusted as the
need arises to bring the current account into balance and begin repayment of
d). Depending on the internal productive
resources available to the economy, new electronic cash (called E-notes) will be injected into the
financial system to promote inflation-free growth. The new electronic cash
deposits will circulate at the same speed as deposits arising from debt.
e). To balance added purchasing power with added
production and so keep the E-note injection inflation free, 5/6 (83.3%) of the
injection will be used to help fund the individual GMI payments and 1/6 (up to
20% of the virtual wage injection) will be injected into businesses in the form
of a capital grant 08..
06 The proportion of
each dependent child’s GMI available to that child’s caregiver(s) would reduce
with the age of the child. Starting at an age (to be decided later), each child
would have access to the remaining part of his or her GMI. Independent children under 18 would receive
their full GMI.
07 This refers to
incomes. The capital base of asset-rich income-poor households could gradually
fall.
08 The E-note injection could be in
the form of a virtual increase in the minimum wage as discussed in paper 2 of
this series.
f). The new cash deposits in the banking system
would provide the base for significant
increases in bank lending. Supplementary reserve ratios will need to be
introduced into the banking system, over and above existing Basel III capital
adequacy criteria, so that bank lending can be managed by quantitative means
rather than by price. This will need to be done during the first year of the
plan.
g). To reduce systemic inflation, the overnight
cash rate (OCR) will be gradually reduced towards 0% in accordance with
measured macro-economic outcomes. Even if there were to be some residual
demand-pull inflation from the E-note injections, it would still be below the target
threshold in
h). The proposal does not significantly affect
the cost of exported goods and services, though it would increase the cost of
imports.
i). In New Zealand, the plan potentially allows
the Ministry of Social Development to be abolished. Any residual functions
would be transferred to other departments.
For example, special provisions for disabilities and invalids could be
administered by the Department of Health. Benefits paid offshore, the
termination of the student loan scheme and the administration of other
recoverable payments could be handled by the Revenue Department. Training and
employment programs including vocational services for those with disabilities
could be administered by the Education Department. Youth justice services,
adoption, care and protection services for young people and family and
community services could be administered by the Department of Justice. Anything
relating to preventive or social health, including sport, diets and well-being
might go to the education department. Anything relating to curative health and
cure of physical defects would go to the Health Department.
j).
Payment of the proposed wealth tax may involve new bank borrowing because not all
those with significant wealth will have the liquidity they will need to pay the
tax. Since the proposed wealth tax is substantial, the additional resulting
deposits will tend to be inflationary and the additional borrowing will need to
be sterilised. This can be done through savings schemes or through central bank
open market operations to siphon off excess liquidity.
k).
The GMI will improve the purchasing power of most union members. The trade
union movement is expected to be strongly attracted to the Plan because it provides a systemic bottom up
approach to reducing income disparity rather than a top down approach.
The
plan does not automatically remove systemic inflation from the economy. As in the past, wages may increase to reflect
price changes induced by inflation as well as to allow employees to enjoy a
share of increased productivity. The whole economy will continue to inflate by
an amount equal to the systemic inflation, which is expected to be about 1.8%
in
Duration
the plan implementation it would be advisable to keep annual wage increases to
less than 2.5%, that is, up to 1.8% for inflation and 0.7% for productivity
gains.
An
agreement with the unions would be helpful because there will be some pressure
to increase incomes above the median wage to restore skill differentials in the
labour market. Skilled employees should not be worse off under this plan than
they would have been without it. Upward pressure among middle incomes is dealt
with by making the tax system more progressive by adjusting tax thresholds to
maintain income differentiation 09.
Overall, average income families with children do best under the
particular GMI solution give in Tables 1 to 4 below.
l). Plan continuity
There
is at this time enough spare capacity in
09 One way to do
this would be to replace existing taxation with a single automatically
collected Financial Transactions Tax
(FTT) . The FTT would be deducted whenever transfers are made out of any
deposit account except a savings account in the name of the same
depositor. That would raise
“consumption” taxes by about 80% and allow income taxes to be abolished.
FTTs are strongly progressive because
they would apply to all transactions, not just those in the productive economy.
10 With a speed of circulation of Vy
of the transaction deposits My of about
Most
New Zealanders on low incomes struggle to make ends meet now. The bulk of the
first cash injections will probably go into new consumption as they are
intended to do rather than into debt reduction. This will change as further
cash injections make debt reduction more feasible. The process can continue
without generating inflation until all the available existing human and
physical resources have been utilised.
From that point there could be a little demand-pull inflation but that will
be offset by the reduction in systemic inflation produced from lowering the
OCR,
Economists
and political leaders throughout the world are calling for an end to
exponential debt growth. This plan does
that by progressive credit monetisation of the existing debt as well as by permanently
reducing the OCR (Official Cash Rate) towards zero, at which point systemic
inflation would be removed from the financial system.
04. THE GMI PLAN DETAILS.
a). The GMI.
Tables 1 and 2 give provisional global figures
for the implementation of a GMI in
Click to see : Table 1. The New Zealand basic
income structure December 2010.
Click to see :
Table 2. Funding of basic income in New Zealand.
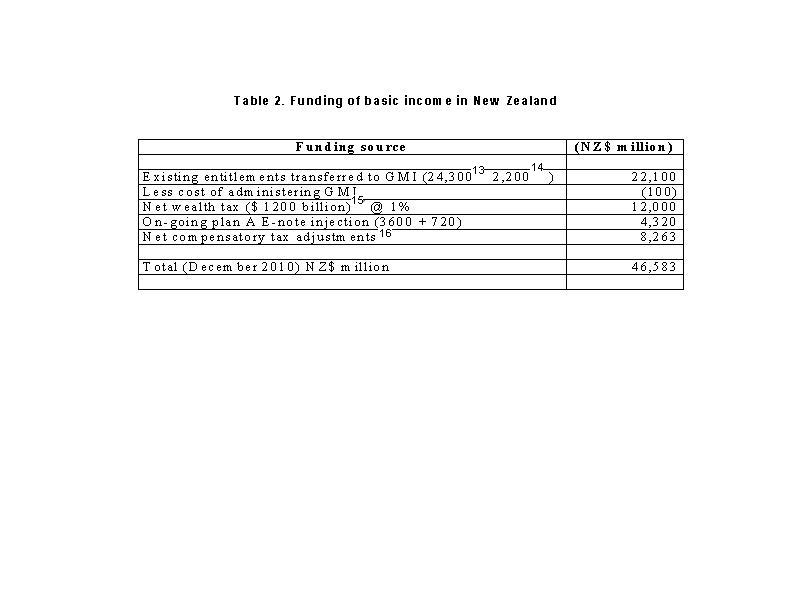
11 The
(updated) figures are derived from a presentation by L F. Manning
at the BIEN (Basic Income Earth Network) bi-annual conference at ILO
Headquarters, Geneva September 2002.
12 Though
their families do if they form a household.
13 Vote Social
Development plus Family Tax Credit NZ$ 2.2b and In-Work Tax Credit NZ$ 0.6b and
veterans payments NZ$ 0.3b
14 Point i) Output expenses NZ$ 500m, debt write downs NZ$
830m, residual transfers to other agencies, say NZ$ 800m, capital input NZ$
70m.
15 Comprising Net
Capital Stock (from National Accounts Table 1.7), Aggregate Land Value
(courtesy Quotable Value NZ), Bank Deposits, and provisions for chattels and
the private household vehicle fleet and for miscellaneous and intangible assets
LESS total debt model debt NZ$ 300 b. Mineral resources excluded.
16 This will tend to
involve increasing the tax rate on earned incomes to offset the GMI paid to
each legally resident individual in the country as detailed in the Plan. This paper proposes a flat tax rate of
41.5% on earned income,
which seems to satisfy the social and administrative objective of the GMI
proposal.
Table
3 provides a few comparisons between the proposed GMI including housing
allowances and the existing social welfare net. Comparisons can be difficult
because the current operational accommodation supplement in
The
second accommodation supplement figure in the table (Area 2) applies to the
rest of
Click
to see : Table 3 Selected comparisons GMI & existing
transfers 17.
17 In Table 3 “Adult
ben” and “Child ben” refer to the existing individual transfer payments, “Accom
Max” refers to the highest accommodation allowance available in each of the 4
“Areas” of the country, “other” includes
the existing Family Tax Credit and In-Work Tax Credit (but does not include smaller special payments that might be
available from time to time). And “Total Max” is the total available from
existing transfers used for comparing existing transfers to the GMI.
18 Tax credits are
arbitrarily based on NZ$35000 joint income
19 The effect of the
wealth tax on pensioners is not included here.
20 Student
allowances in
The
Table 3 GMI is set to mirror the maximum Area 3 supplement. Some care will need
to be taken to ensure adults living in families where the family owns more than
one dwelling do not register the adults separately on the electoral roll at
their other addresses to obtain additional housing provisions to which to which
they are not entitled. The housing provision belongs to the adults collectively
residing at their place of residence. Claiming a housing provision for a
dwelling, for example, a holiday home, where the adult(s) do not normally
reside would be fraudulent.
b).
The GMI funding.
b(i).
Existing welfare transfers.
For
simplicity this paper bundles together as transfers the whole of the 2010
The
transfer incomes in Table 3 do not include work incomes beneficiaries are
allowed to earn before their benefit is abated. Under the GMI there is no
abatement regime. The so-called “poverty trap” where the incentive to work
becomes minimal is eliminated. At present after tax work incomes may in some
cases be less than the aggregate transfer payments, especially where travel and
other work related costs are taken into account.
Since
a substantial portion of the population receives some sort of transfer payment
The
GMI is designed to be “transfer-neutral”. Beneficiaries receive much the same
in hand as they do now. The rest of the GMI is distributed among the working population. The proposed GMI is not an extra “handout” to
beneficiaries. Instead, it eliminates all the complexities of the existing
welfare system while allowing everyone to participate in measured productive
activity and keep what they earn after tax.
The
GMI makes it attractive for everyone to make a productive contribution to the
economy, even for a mother with young children to work part time from
home.
The
GMI provides a living income as of right. It also re-establishes the right to
work by choice. It provides support to
middle-income families in particular.
b)(ii).
The wealth tax.
Wealth
taxes are redistributive because they reverse the accumulation of net wealth
inherent in the presently dominant debt-based financial system. Only a few
countries use them. Some countries like
The
wealth tax used in this paper is a uniform tax on all net wealth from all
sources applied across the board, including publicly owned land and other
public assets.
21 But excluding minerals.
22 The total land
values for
In
addition to Land and the Net Capital Stock the gross Capital Assets in this
paper include all bank deposits, provision for the private non-commercial vehicle
fleet, an allowance for private non-commercial chattels and a modest provision
for other less tangible wealth. The total comes to about NZ$ 1500 billion. This
gives a net asset base of NZ$ 1200 billion after deducting the total debt NZ$
300 billion outlined in the debt model in Appendix 2 to this paper. Further
research will be needed to improve the accuracy of the asset base, not least
because many people in
Whether
or not some assets such as family homes, private vehicles and chattels should
be exempted from the wealth tax calculation is a decision beyond the scope of
this paper. Any reduction in the wealth tax base below that shown in Table 2
will either mean the wealth tax rate would need to be higher than 1% or there
would need to be higher compensatory tax adjustments. Otherwise the GMI shown in Table 1 may not be
fully funded.
Another
wealth-tax related issue is the relationship between the assessed tax and the
liquidity level of those paying the tax. If, for example, a person or business
has net assets of NZ$ 1 million, that person or business would be liable for a
tax of NZ$ 10000/year. If the tax is
paid from the liquid resources of the person or business being taxed, or if
that person or business sells assets to obtain the funds to pay the tax, the
tax transaction is “cash-neutral” for
the economy as a whole. If, on the other
hand, the tax levy is paid from new bank borrowing, the new deposits arising
from that debt are potentially inflationary. There are several ways to offset
those new deposits. Savings schemes and the sale of Treasury Bills are
examples. In any case appropriate financial instruments must be in place and
available for use as the need arises.
b)(iii).
The injection of electronic E-notes.
New
electronic cash (not debt) will be supplied to help fund the GMI. The new
electronic cash deposits would circulate at the same speed as deposits arising
from debt. The first cash injection has been set at about NZ$ 3.6 billion plus
a further NZ$ 720 million provided as capital grants to business.
The
Central Bank does not need new legislative authority to make an injection of
electronic cash into the economy. The money in the proposed plan will be used
to increase incomes. It is not a subsidy to business, though business will be
rewarded for its participation in the scheme and to stimulate business
development. The plan is a
non-inflationary way to increase wage-earners’ purchasing power. It is made
possible through the greater understanding of the operating mechanisms of the
existing interest-based debt system provided by the debt model discussed in
detail in the appendices to this paper.
b)
(iv) Revision of the tax thresholds and tax
rates for middle and upper income groups.
The
GMI as it is shown in Tables 1 and 2 requires an income tax adjustment of NZ$
8.623 b. in addition to the NZ$ 12 billion raised from the wealth tax. That
additional income tax is not new tax because every taxpayer receives his or her
GMI, which is tax-free. At an individual level, as long as the tax adjustment
does not exceed the difference between the new GMI and the sum of any transfer
payments payable under the existing tax system, the individual cannot be worse
off. A similar principle applies at the
household level.
The NZ
budget for the year ended 31st June 2010 23 shows
individual direct taxes of NZ$ 24.3 billion and corporate taxes of NZ$ 7.6
billion drawn from a tax base of some NZ$ 109 billion 24 or NZ$ 31.9
b. all in. The average effective tax rate is therefore NZ$ 31.9/109 b. or
29.3%. Adding NZ$ 8.623 to NZ$ 31.9 billion increases the average tax rate on
earned income to 37.2%.
23 Befu (Budget
Economic and Fiscal Update) 2010 p. 132 Notes to the Forecast Financial
Statements
24 Using
compensation to employees of NZ$ 84b and net taxable business profits of NZ$
25b: there might need to be minor adjustment depending on the measured state of
the economy.
In
practice, in
The
relationship between the wealth tax and the proposed flat tax rate is a
political matter. The solution given in Tables 1 and 2 is an arbitrary “middle
of the road” choice. The wealth tax could be set a little lower than 1% and the tax
substitution increased from NZ$ 8.623 b. accordingly. That would increase the
flat tax rate applied to personal earned incomes above 41.5%. The public at large is likely to see a flat
tax rate above 41.5% as a psychological
barrier though such figures are common throughout
The
GMI can be fully funded by a 1% wealth tax and a flat tax rate of 41.5% on all
earned personal income (therefore excluding all GMI payments) compared with the
present level of 29%. Strong tax progression is guaranteed by the wealth tax
and the relative gain from the GMI provided to families with children and low
income earners. This lowers the tax profile among lower- income earners and
families with children and raises it among wealth holders. Table 4 shows most people with
middle and lower incomes are better off under the GMI.
The
author of this paper considers a flat tax rate of 41.5% to be “saleable” to the public at large. A
higher wealth tax and a lower flat tax rate would be attractive to income
earners, but is likely to be more strongly opposed by wealth holders who would
feel they are paying a disproportionate share of the GMI funding. It would also
tend to weight the GMI too far towards lower and middle-income families.
Click
to see : Table 4 : Comparison of GMI with existing earned incomes.
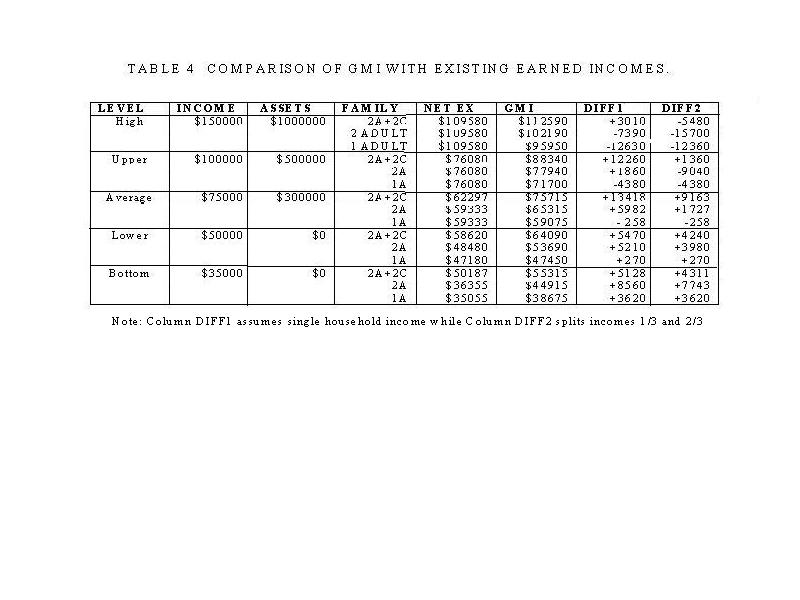
Table
4 25 clearly shows how the
GMI shift favours families with children and people with lower incomes. The
redistributive shift in terms of total incomes can be statistically calculated.
That lies outside the scope of this paper but it could be several percentage
points of GDP.
Whatever
format is chosen political decisions on the distributive effect of the GMI will
need to be made. The present proposals will bring
25 Details are
provided in Appendix 4. Income splitting, that is, dividing the specified
income between the two adults in a household will reduce the existing taxation
and so reduce the positive figures shown in the table. That applies especially to households with 2
adults but also to 2 adult-families
with children. The column Diff1 is
without income splitting. Column Diff2 assumes income splitting where 1 adult
earns 1/3 of the household income and the other adult 2/3.
c).
The Foreign Transactions Surcharge (FTS).
It is advisable to introduce a Foreign Transaction Surcharge (FTS) as
soon as possible to protect against the export of assets (financial leakage)
offshore. The proposed wealth tax at 1% is low, and most wealth cannot be
exported, but financial issues could arise if there were some capital flight.
An FTS would be
simple to administer 26. It has very rarely been used in the past 27.
Introducing a financial instrument such as the FTS is essential in the medium
term if offshore borrowing and related interest costs, which are among the main
causes of exponential inflation in
26 The “beauty” of
FTS is that it applies to outward capital flows, not inward capital flows.
Moreover, FTS is not a “restriction” on capital flows , it is a universal tax
on all outward transactions.
27 It was used
successfully in
28 Setting the
parameters for that regulatory framework falls beyond the scope of this paper.
A broader issue is whether a
foreign transactions surcharge would contravene international financial
agreements. There are provisions in the relevant international World Trade
Organisation (WTO) protocols for countries to protect their balance of
payments. The GATT legal text, Article XI clause 1 appears to specifically
permit non-discriminatory taxes to be applied. Provision of funding is a
service that falls under the GATS protocols.
The
so-called policy “trilemma” is important to any debate on the FTS. Obstfeld
(1998) put it this way: “In most of the world's economies, the
exchange rate is a key instrument, target, or indicator for monetary policy. An
open capital market, however, deprives a country's government of the ability
simultaneously to target its exchange rate and to use monetary policy in
pursuit of other economic objectives”.
If the current account is to
be managed, some form of exchange management will be required. To restructure
the financial architecture as proposed in this paper, a tool such as the FTS
will have to be inserted at the currency exchange interface. Failure to do so could condemn the world to
economic ruin. It is now widely, if not yet universally, acknowledged the
current economic system is deeply flawed as suggested or implied in recent
articles from the Bank for International Settlements, the World Bank, and
leading economists like Joesph Stiglitz and Paul Krugman.
The exchange management instrument(s) would apply to
all outward exchange transactions, not just outward capital flows.
The proposed FTS is
not a tariff or trade barrier of any kind. Nor is it a restriction on capital
flows as such. It can be adjusted
29 Under the gold standard,
capital flows appear to have been unrestricted, but they were not the dominant
feature in financial flows they have become in recent decades.
30 The famous
Bretton Woods meeting was where the basis for the post World War II financial
architecture was agreed among the allied powers. The British position was
effectively vetoed by the
Financial receipts
from the surcharge would be used to offset a corresponding amount of domestic
taxation (for example by reducing GST), to make the surcharge tax-neutral apart
from any receipts put towards foreign debt reduction. Its intent is to correct
the current account, which is part of the balance of payments as defined in the
legal WTO, GATT, GATS texts, by removing the existing subsidy enjoyed by those
engaging in foreign currency transactions at the expense of those who do not.
Those using foreign currency in
The proposal for an
FTS also deserves mention in the context of ongoing negotiations for a TPPA
(Trans-Pacific Partnership (Free Trade) Agreement) presently being negotiated
among eight
The overall saving
to the wider New Zealand economy from the introduction of an FTS is likely to
be more than the annual current account deficit itself 34 . In
addition to the obvious reduction in interest costs and the amount of foreign
debt there are consequential “downstream” benefits to the economy of a country
like
A foreign
transactions surcharge would cause the exchange rate to fall towards a stable
base level, allowing exports to increase and imports to decrease, providing a
more even playing field for local manufacturers and producers 35.
31
32 For
example,
33 The author of this paper is not aware of amy remission policy in cases
where the PPMs (Process and Production Methods) is MORE carbon efficient than
the corresponding
34 Each
1% in interest rate alone represents nearly NZ$ 3.1 billion per year on a total
debt of around NZ$ 311 b., including net foreign debt, as at March 2011.
Estimating the actual economic effect of FTS is outside the scope of this
paper.
35 Rose (2009) notes that exchange
rates have relatively little influence on imports, but it is likely that the
FTS would act more directly on the import sector because it is visible as it is
drawn directly from bank accounts.
Introduction of the
FTS could allow the removal of all remaining tariffs and subsidies in the
The FTS can also be seen as a
correction designed to offset the unmanaged volatility in
36 Source: Reserve
Bank of
37 New Zealand
National Accounts for the year ended March 2009.
38 The outward
payments would fall from their present level and inward receipts would
increase.
39 This could be
done through some form of tender process.
The worked indicative example for Option (B) at Table
40 The Keynesian
transfer problem implies the current account should go far enough into surplus
to meet all transitional foreign
investment claims, though that might be optimistic in the short term.
There would be a substantial
reduction in interest payments as the current account is brought under control,
foreign debt repayment begun and inflation reduced to very low levels. Rose
(2009) notes: “Effectively the market is
pricing country and/or currency risk into national interest rates”. On the
other hand, the
Bertram (2009) notes that “In the worst case, where no
rolling over of offshore funding was possible at all, the banks would be
obliged to raise New Zealand dollar funding to pay down their foreign-currency
debt”. That would produce
a sharp fall in the exchange rate. The FTS is a very powerful economic tool
because of its redistributive impact within the domestic economy 41.
41 On
the other hand, debtor countries may be better off “biting the bullet” and
dealing with their foreign debt sooner rather than later. Since the volume of
exports cannot be rapidly increased, the FTS must rely on changing the
relationship between the NZ$ value of exports and imports.
The share of the
Banks would quickly unwind
their dependency on foreign debt when the funding rate falls below what they
are paying offshore. Transitional
arrangements may be needed to favour the replacement of foreign funding with
domestic funding though, at the end of the day, the only way to retire the
accumulated current account deficit is through the exchange settlement
mechanism. A debtor country like
Some academic
literature supports the need for some form of foreign exchange management to
correct the balance of payments and the current account. “Pegged” exchange rates
have been widely used by major countries, including
Preston (2009)
argues that the levels of the
The FTS outlined
above is much broader in scope than
d). E-note injection.
This has been discussed under point b(iii)
above.
e). Capital injections for
business.
Supply a corresponding injection to businesses
to facilitate business growth, to be paid to businesses weekly. This
supplementary support for businesses has been arbitrarily set at 20% of the
direct GMI injection, that is, 20% of NZ$ 3.6 billion, or $720m/year. It will appear in incomes as firms spend it.
In many countries, the business gross operating
surplus is 50% or more of the purchase price of goods and services. It is
therefore usually beneficial for firms to expand production capacity as demand
rises. Businesses will be required to show how they use the capital grant
provided to them to increase productive capacity. All businesses employing wage
and salary workers will be eligible, The proposed level of 20% of the planned
initial E-Note injection of NZ$ 3.6b/year would provide an annual capital
injection to business of about NZ$ 500 for each FTE (Full Time Equivalent)
worker, or in round terms, about NZ$ 10 per worker per week. This would, in principle, continue
indefinitely.
f). Supplementary reserve
ratio.
This
plan will progressively and significantly increase cash deposits in the banking
system. The difference between cash deposits
and deposits arising from debt is that cash deposits reduce the banks’
risk-based capital requirements thereby increasing their lending capacity. Nobody can default on a cash deposit because
it can’t be liquidated. Cash deposits remain somewhere in the banking system
unless they are used to repay debt. That
makes a credit (electronic cash) based financial system inherently more stable
than the existing debt-based system.
Bank
deposits will continue to increase, but at a slower rate than during recent
decades. The increased deposits will result from population expansion and from
residual systemic inflation. They will tend to be offset by increased
productivity derived from increases in employees’ purchasing power. The growth
of debt in the economy will reduce towards zero as the OCR is progressively
reduced towards zero, eliminating most, if not all, exponential debt growth.
The
main element of past exponential debt growth has been the use of the price
mechanism to “manage” it. This has turned out to be a perverse system. The debt
model set out in the appendices shows how raising interest rates increases
systemic inflation instead of reducing it.
During downturns and recessions the systemic inflation is still there.
Higher inflation is, however, masked by falling purchasing power caused by
higher debt financing costs, falling production with aggregate discounting of
goods and services by producers leading to a reduction of their gross operating
surpluses. It is not in consumer prices and therefore tends to go unnoticed.
Since
cash deposits increase banks’ nominal lending capacity this paper proposes
using variable supplementary bank reserve ratios to limit bank lending. This is
to avoid risk of added inflation caused
by increases in circulating debt My over and above what is needed to
maintain real GDP growth within the resource constraints of the economy.
There
is nothing new about reserve ratios for bank lending. Most countries still have
them in some form even though they have usually played a minor role in economic
management in recent years. How the supplementary deposit ratio would be
incorporated in this plan is outside the scope of this paper. Its purpose is to
slow down the exponential growth of bank lending as new debt is replaced by electronic
cash injections so that systemic inflation can be reduced and eliminated
altogether over time.
Over
the longer term, household debt can be first stabilized and then gradually
reduced. The banks will be gradually transformed into savings and loan
institutions. This process will reduce systemic banking risk while at the same
time maintaining banks’ profit margins.
The
main change under this GMI Plan will be the elimination of unsustainable
exponential debt growth. This is what the world wants to happen. Orthodox
economics offers no mechanism to achieve it.
g).
Reducing the OCR (Official Cash Rate).
The introduction of electronic cash credit
injections and variable supplementary reserve ratios into the financial system
allows gradual reduction of the OCR (Official Cash rate) and removal of systemic inflation from the
financial system. The financial system
becomes based on the quantity of debt rather than its price. The persistent problem of exponential debt
growth will be solved. Over time, interest-bearing debt can be removed entirely
from the financial system.
From a systemic point of view, the decline in
the OCR can be carefully managed to allow the
The plan does not, of itself, resolve either the
current account deficits of debtor nations or the current account surpluses of
creditor nations. It does, however,
provide a platform from which the exchange rate and current account can be
effectively dealt with using other options such
as the Foreign Transactions Surcharge (FTS) discussed briefly below.
From the structural macroeconomic point of view
debtor countries clearly need to get their current account deficits under
control. One mechanism to do this is by
applying a variable Foreign Transactions Surcharge (FTS) whereby a currency
exchange surcharge is automatically collected whenever domestic currency is
converted into foreign currency. It
would have no effect on export prices, but it would increase effective import
prices. The proposal would be made tax neutral by reducing domestic taxation by
the amount of the surcharge collected.
h).
Effect of the GMI on the cost of export goods and services.
Conceptually,
the GMI is not inflationary. It is redistributive. It corrects the exponential
flow of deposits from the productive sector into the investment sector. Orthodox economics suggests that pricing
capital will make its use more efficient. The net capital asset base in
Inflation risks are in the low to medium range
and are off-set by the re-introduction of supplementary reserve ratios into the
banking system. Reserve ratios are also needed when a Foreign Transactions
Surcharge is used to manage the exchange rate to help prevent capital flight as
the OCR and consequently the exchange rate are reduced. The plan does not
provide for increases in wages beyond the usual provisions for inflation and
productivity increases.
The proposed initial FTS of 10% is modest
compared with regular fluctuations in the
i).
Potential abolition of the Ministry of Social Development.
A GMI
offers a vast array of benefits for society at large. They range from
increasing the pool of people able and willing to work, increasing the freedom
and independence of women and relieving financial pressures on families. GMI
creates other “downstream” possibilities too. For example, increases in
disposable incomes for low income earners and families could favour the
introduction of “at source” health-based excise taxes on unhealthy foods
similar to those on for tobacco and alcohol, with the long term objective of
reducing health care costs arising from problems such as obesity, diabetes and heart
disease.
There
will always be people with special care needs and children and families with
special problems. With GMI there will be no need for the Ministry of Social
development’s Work and Income functions that presently make up the vast bulk of
its administrative output. Residual
outputs of the Ministry could be distributed among other relevant departments.
The GMI itself would be administered by the Revenue Department. Special needs
payments would be administered by other departments on a case by case basis.
Issues relating to family violence and abuse could be handled at arms length by
the Justice Department that already administers the parole system and the
family courts. Social health issues could be handled by the Ministry of
Education. Curative health issues including care for the handicapped and the
aged could be handled by the Ministry of Health.
The
introduction of GMI will remove the stigma of social dependency and poverty
existing systems try to avoid but, by their nature, inevitably create. Those
are issues that lead to many of the social problems so characteristic of
industrialised societies. Under the GMI, individuals receive their own income as of
right. This should favour review of compliance measures like those
related to the child support programme which are so difficult to administer
under the present system.
j). Wealth tax can create new bank borrowing.
One
further potential inflationary effect from Plan B is the possibility that some of
the wealth tax will be borrowed into existence where those liable for the
wealth tax do not have liquid resources to pay the tax or choose not to dispose
of wealth to generate the deposits needed to pay the tax. Most people with
substantial net assets will also have substantial incomes so this issue mainly
affects a limited number of asset-rich, cash-poor families. For example, a
pensioner couple living in a mortgage-free home worth, say NZ$ 500,000 would
need to find at least NZ$ 5000 each year to pay their wealth tax. From Table 3,
that couple’s GMI income would be NZ$ 570/week compared with about NZ$ 512 now,
since they will not at present be eligible for an accommodation
supplement. The wealth tax will leave that
couple at least NZ$ 2000 short each year in comparison with what they get now
because while their GMI will be NZ$ 3000 higher than their present income their
wealth tax will be at least NZ$ 5000.
The GMI plan include measures to offset any minor inflationary impacts
caused by borrowing to cover the difference.
05. CONCLUSION.
The
paper sets out the underlying economic problems relating to the exponential
growth of debt and offers a plan based on a Guaranteed Minimum Income (GMI) to
deal with them. The private interest-bearing debt-based financial system
generates systemic exponentially increasing transfers of wealth from the
productive sector of the economy to the investment sector. The transfers take the form of net interest
paid on bank deposits. The deposit
interest has to be funded from the productive economy. This causes an
inflationary expansion in the debt levels the productive economy has to
service. Over the past few decades, the orthodox economic approach to that
inflationary expansion has been to increase the price of debt by raising
interest rates. Not only is that
approach shown to be counterproductive, but debt levels in developed economies
are now so high that small increases in interest rates are enough to force them
into recession. Interest rates now have to be reduced close to zero to
stimulate the economy.
The
plan introduces a Guaranteed Minimum Income for each legal resident as of
right, thereby eliminating the need for social welfare programs and releasing
potential productive capacity presently locked into welfare dependency and
poverty.
The basic details of the proposal are shown in
Tables 1 and 2. The GMI will free a large pool of productive capacity that is
barely used now. That capacity arises because all welfare-induced constraints
on productive activity will be removed.
Everyone will be able to contribute to the economy and be rewarded like
everyone else for doing so. The GMI has
been set to match existing social transfer incomes. The plan is sufficiently
accurate as a first approximation, though the numbers may need minor adjustment
or updating here and there depending on the political policy perspective
adopted by those implementing it. The GMI proposal shown in the plan is unique
as it is the only one to incorporate a universal housing allowance without which
it is not possible to generate a simple GMI that matches the existing transfer
system. Failure to match existing
transfer payments would be politically unacceptable as system implementation
would create winners and losers and funding would become very difficult to
manage. Table 3 shows that the proposed GMI follows the existing transfer
system very closely.
The GMI is funded by a combination of
redirecting most existing transfer payments to the GMI, a 1% wealth tax on all
net capital assets, an annual electronic cash injection of NZ$ 4.32 billion and
rearrangement of existing taxation. The
plan shows that one socially acceptable solution is to have a flat-tax of 41.5%
on all earned income, bearing in mind that the GMI itself is not taxed.
The tax rate taken over both the untaxed GMI and
earned income will be less than what it is now for the majority of income
earners including almost everyone in the low to middle income bands.
Appendix 3 examines 15 specific household
incomes. The results are summarised in Table 4 which shows how net GMI incomes
relate to existing net incomes. It
proves the proposed tax rate of 41.5%
and a 1% wealth tax together give “appropriate” GMI
outcomes when compared with the existing earned income structure. More work will be needed to fine-tune the
proposal. For example, Table 4 first considers the case where there is just one
income earner per household. Income
sharing among adults reduces the positive “difference” figures shown in the
column “Diff1” in Table 4 because shared incomes reduce the income tax paid by
the household compared with the amount presently paid by a single earner. The
result with a 1/3 and 2/3 income split is shown in column “Diff2 of Table 4.
Overall GMI outcomes for most families will be close
to or better than what they are now. The particular GMI solution selected for
this paper deliberately weights those net final outcomes in favour of families
with children and lower incomes to offset the rapid increase in income
inequality that has occurred in
The introduction of a Foreign Transactions
Surcharge (FTS) is also proposed. The FTS serves two main purposes. The first
is to avoid any risk of capital flight arising from implementation of the GMI.
The second is to provide a powerful ongoing instrument to regulate the exchange
rate and progressively repay the nation’s foreign debt. The FTS is a variable tax on all foreign
transfers of NZ currency. It would start at about 10% and be automatically
collected through the banking system. The income received would be used to
reduce domestic taxes, such as GST, and to begin foreign debt retirement. The proposed 10% initial level for the FTS is
lower than the recent percentage variations in the NZ$ exchange rate. The
proposed FTS rate would apply to ALL exchange transactions including
speculative financial transactions, though it would be technically feasible to
apply more than one rate.
The FTS appears to come within the rules of
existing international protocols such as GATT and the WTO that allow for protecting
a nation’s balance of payments. It is important that this position is reserved
in any TPPA (Trans –Pacific Partnership Free Trade Agreement) the country
decides to enter into.
06. APPENDIX
1 : THEORETICAL BACKGROUND.
The
first paper of this series (Paper 1) “The Interest-Bearing Debt System and its
Economic Impacts” 42 looked at the fundamental cause of exponential
debt growth and proposed several key concepts:
(a) The fundamental debt problem is that the
economy has institutionalised the payment to deposit holders of unearned
income.
(b) That unearned income takes the form of
interest paid on bank deposits.
(c) Interest paid on bank deposits creates
systemic inflation and exponential increase of the debt burden.
(d) Culture
and institutional “capture” of the debt debate has made rational discussion of
the debt problem difficult.
(e) Sustainable debt levels cannot be achieved without removing most
if not all new deposit interest.
(f) Quantitative analysis can be provided using a new debt model of
the economy based on a revised form of the Fisher Equation of Exchange.
Paper 1 showed that the debt
system in
The productive
economy is progressively becoming paralysed. The exponentially growing pool of
unearned deposit income is funded by inflation of the productive economy. The unearned
income investment sector is becoming so large that servicing the nation’s total
debt (including its “foreign debt”) requires a level of debt servicing the
productive economy can no longer sustain unless interest rates are close to
zero43 . The present situation has probably never arisen before, not
even during the depression of the 1930’s.
42 L.F.Manning, Sustento Institute Christchurch., September
2010. This is published as PAPER 1 :THE INTEREST-BEARING DEBT
SYSTEM AND ITS ECONOMIC IMPACTS.
43 Some of the inflation is
masked by the current account deficit and offshore borrowing.
Orthodox economic
instruments such as the use of interest rates to manage inflation mask systemic
inflation at the cost of economic growth.
The inflation cost is still there and it is still being paid, but it is
being paid in the form of lost production and unemployment instead of showing
up in prices.
Appendix 2 provides
detailed evidence of the current position for
The world’s
financial system is approaching a state of collapse and cannot be repaired using
orthodox economic theory. Orthodox
economics has failed to reveal the fundamental mechanisms at the root of the
debt problem or to offer any practical long-term solution to address it.
07. APPENDIX 2 :
THE THEORETICAL SUPPORT FOR THE PROPOSAL.
The first version
of the debt model was published in the paper:
Manning, L “The Ripple Starts Here: 1694-2009 : Finishing the
Past”, presented at the 50th
Conference of the New Zealand Association of Economists (NZAE),
While the debt
model is based on the volume of debt, it is unrelated to earlier volume-based
reform proposals like those of Social Credit that failed to offer a viable
theoretical basis to support them.
The premise in both
the debt model and Figure 4 is that the circulating deposits and cash My
= Prices P x output q where q is the quantum of domestic output produced by My
over a single cycle. Taken over a whole
year, the SNA definition of Gross Domestic Product GDP is given in the debt
model by mathematically integrating the expression Pq* Vy, where Vy
is the number of times the circulating deposits and cash My are used
during the year 45.
The SNA should
reflect an expression of the original Fisher Equation of Exchange as shown in
Figure 2 46. The only difference
is that the money supply M in the Fisher equation of exchange included hoarded
cash, whereas in the debt system shown in Figure 2 for practical purposes there
is now very little cash contributing to measured GDP.
In Figure 4 My
cannot include hoarding of debt beyond the term of the production cycle because
all the productive bank debt giving rise to My is conceptually
repaid at the end of the cycle 47.
44. http://www.nzae.org.nz/conferences/2009/pdfs/The_Ripple_starts_here_1694-2009__Finishing_the_Past.pdf
. Non-members can access the paper by Google search: NZAE The Ripple Starts
Here (use “quick view”).
45. The
contribution of cash transactions in industrialised countries is now (very) small.
46. The Fisher
equation has been very widely discussed in relation to the economic
difficulties arising from the sub-prime mortgage defaults in the
47. As previously noted,
in practice there is a continuous flow of production and consumption so the
deposits and cash My are always
present, but they are being used in the production cycle, not hoarded.
At any point in
time there are five broad blocks of deposits in the domestic financial system.
They are:
Mt The transaction deposits representing the
productive debt My - M0y so:
My
= Mt + M0y (1)
Mca The
accumulated domestic deposits representing the sale of assets to pay for the
accumulated current account deficit (see section 5 of this paper for
details).
M0y The cash in
circulation included in Mv and used to contribute to productive
output.
Ms The net after
tax accumulated deposits arising from unearned deposit income on the total domestic
banking system deposits M3 (excluding repos) 48.
(M0-M0y) Cash hoarded by the public and not used
to generate measured GDP.
In this paper the
total of these deposits, that is, Mt + Mca + M0y
+ Ms , is provisionally assumed to be the M3 (excluding repos)
monetary aggregate published by most central banks monthly less the amount of
cash in circulation M0 except for the part M0v that is included in My. In this paper M0y is assumed to
have the same speed of circulation as My. In industrialised countries, the contribution
of cash transactions to the measured output of goods and services (GDP) has
been declining in recent decades and their contribution to the GDP has been
provisionally calibrated for the purposes of this paper 49.
In this paper, the
total debt in the domestic financial system is assumed to be the Domestic
Credit, DC debt aggregate published by most central banks monthly.
At any point in
time there are four broad blocks of domestic debt in the domestic financial
system. Three of them together add up to DC such that:
DC = Dt + Dca 50 + Ds
(2)
Where
Dt The
productive debt supporting the transaction deposits Mt.
Dca The whole of the debt created in the domestic
banking system to satisfy the accumulated current account deficit 51.
Ds The residual debt to balance equation (2)
48. Repos refer to
inter-institutional lending
49. More accurate assessment
of the cash contribution to GDP over time requires further detailed study.
50. Arguably the
accumulated sum of capital transfers could be included here, in which case the
net international investment position (NIIP) would be used instead of the accumulated
current account. The decision affects the size of the “residual” Db.
51. This is greater
than the monetary deposits Mca because the
banking system may have sold commercial paper to borrow foreign currency to
satisfy the foreign exchange settlement.
The fourth block of debt is :
Db, the virtual “bubble” debt, the excess
credit expansion or contraction in the banking system such that Ds - Db = the debt supporting the accumulated deposit interest Ms defined
above. Db can be positive or
negative as discussed further below in relation to Figure 5.
There is also a
fifth block of debt Is that is, conceptually, not bank debt .
Is, the
total debt accumulated by investors arising from Saving Sy = S/Vy.
The investor pays
the investment Iy =I/Vy = Sy = S/Vy to the producer and the money is used to
retire the outstanding part of My relating to the investment in
question. Conceptually the investor borrows the purchase price from employee
incomes and the business operating surplus as discussed in section 7. Except
for households buying new homes discussed separately on pages 27-28, the
investor then becomes a producer, and the interest on investment Iy
is included as a production cost in the subsequent production cycle loans My.
The predicament of
new homeowners is quite different. They cannot service their debt because they
cannot, conceptually earn more than they were before they bought their new
home, because the home itself is nearly always unproductive. There is no new
income stream from their housing investment. If economic demand is to be
maintained, homeowners must, in aggregate, rely upon increasing house prices
and refinancing of their properties, creating an aggregate “pass the baton”
systemic increase in debt.
When non-productive investment assets
are traded there is typically a capital gain because of asset inflation on
investment (Dca + Ms + the property component of Is). The new purchaser pays more for the asset
because of asset inflation, allowing the seller to retire the outstanding
mortgage debt on the property.
By definition in this paper :
My x Vy
= GDP
Ms = Ds
The cash contribution to GDP =
M0y * Vy. Therefore :
DC = (GDP)/Vy - M0y + Ms + Dca
+ Db (3)
Ms =Ds =
(DC – Dca ) – GDP/Vy + M0y - Db (4)
GDP = Vy *(DC - (Ms +Dca
+Db ) + M0y ) (5)
My = GDP/Vy
= DC - (Ms +Dca + Db) + M0y (6)
Where the terms are as defined
on pages 28-29.
Equations (3 ) to
(6) are all forms of the debt model developed in previous papers 52.
52. Links are provided in the conclusion to this paper.
Ms is
the same format as Ms in the earlier forms of the model. It has been freshly
calibrated. Unlike the previous forms of the model equations (3) to (6) are general
and include the contribution made to the economy by cash transactions.
In equation (4),
all the terms except GDP/Vy = My and Db are
known or can be estimated with reasonable accuracy. For the purposes of
equations (1) and (6) My can
be approximated using trend-lines because it is small compared with Ms.
Db is unknown but can be approximated through the calibration as in
Figure 5. The calculations in equations (5) and (6) involve the subtraction of
large numbers to get relatively small numbers, which leaves them sensitive to
modelling and data error.
If Ms,
calculated as “the accumulated deposits arising from unearned deposit income on
the total domestic banking system deposits M3(excluding repos) ”agrees
more or less with that calculated in equation (4), bearing in mind the value of
Mb, the proposition that debt growth is determined by deposit
interest will be proven. The model will
require further calibration as further data becomes available. Despite that, it is self-evident Db
will be positive during periods of rapid expansion, particularly as bubbles
form, and will become negative during periods of rapid contraction,
particularly as bubbles collapse. The classic case of this in New Zealand is
shown in Figure 5. Financial contraction continued following the 1987 share
market crash long after the asset bubble was gone.
The dependence of
the gross domestic product (GDP) on the Domestic Credit DC and the interest
rate on bank deposits in the modern cash-free economy from which Ms
is calculated has profound implications for economics.
In the light of the
worldwide financial chaos of 2007-2009 the indicative debt model shown in
Figure 1 provides a powerful argument in support of public control of a nation’s
financial system.
Click here to view FIGURE 1 : THE SCHEMATIC DEBT MODEL OF A DEBT-BASED ECONOMY.
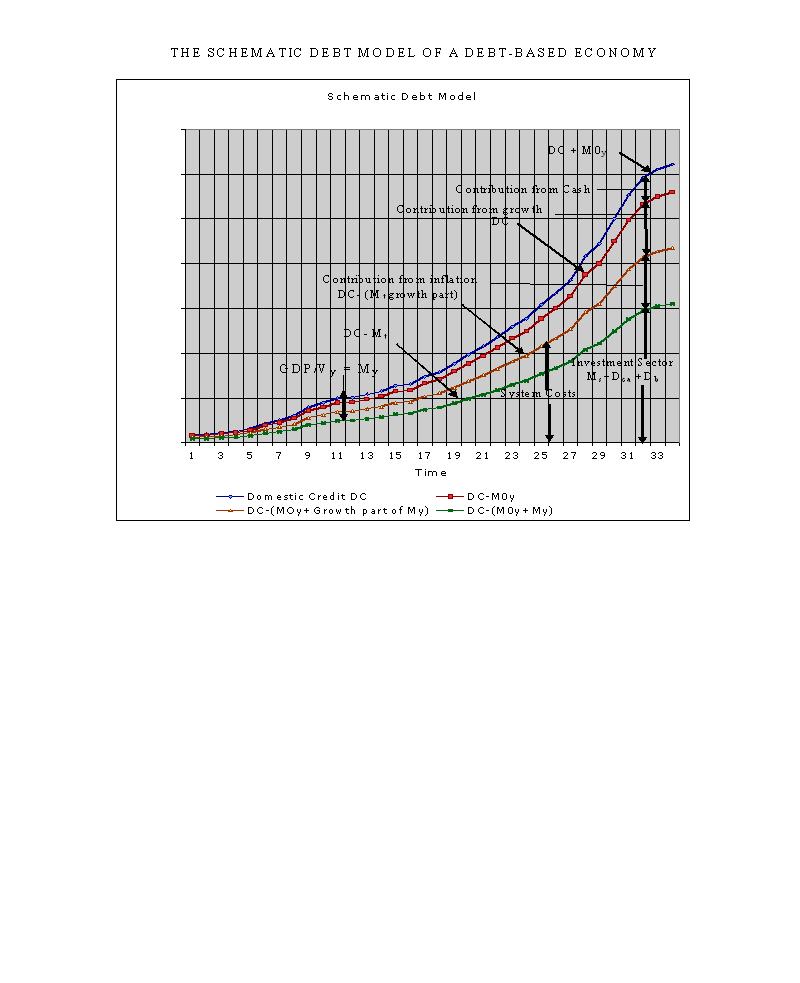
The vertical axis
in Figure 1 applies to the Domestic Credit for
It isn’t possible
to have a simpler model of the economy than equation (5):
My
=Nominal GDP/Vy equals domestic credit DC less (unearned net deposit
income Ms + the accumulated current account Dca + the
cash contribution to GDP M0y plus a correction for bubble activity Db
(+/-))
Domestic
Click here to view FIGURE 2 : EXPONENTIAL DEBT AND
GDP NEW ZEALAND, 1993-2011.
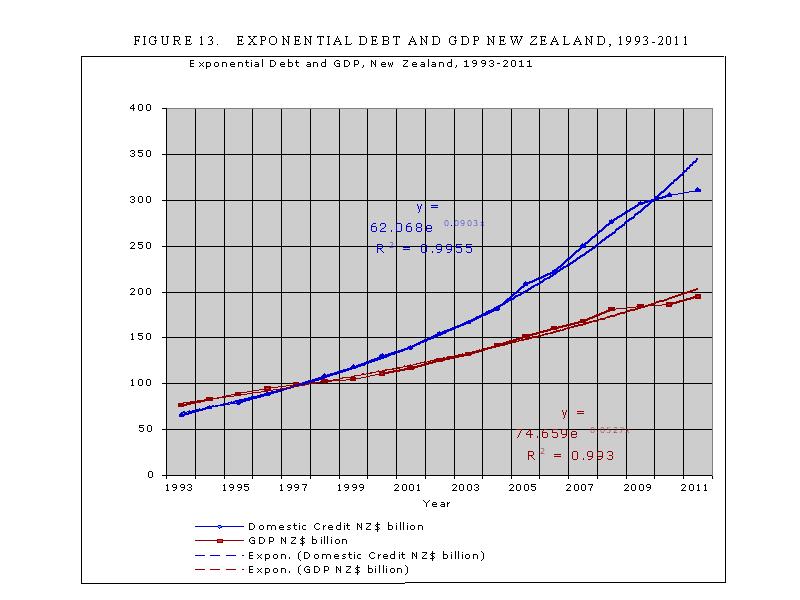
It is theoretically impossible
to maintain exponential debt expansion faster than GDP expansion over an
extended period because the added debt servicing costs will always leave the
productive sector insolvent.
To avoid national bankruptcy,
each nation must maintain, in aggregate, a zero accumulated current account
deficit.
A first
approximation for the speed of circulation Vy of productive debt
plus cash transactions My is given in Figure 3. Vy varies
with the change in the payments systems. Minor secondary shorter-term cyclical
variability also occurs through changes in the average time taken to pay
bills. When times are tough people take
longer to pay their bills, and each change of a day in the time taken to pay
them can alter Vy by perhaps 0.25%. The process is usually reversed
in better times. Otherwise Vy reached a constant value of about
53. Vy is estimated at the moment so the present figures are indicative. Once
further research accurately refines the present estimates, Vy will be sufficiently accurate for predictive purposes.
Click here to view FIGURE 3 : SPEED OF CIRCULATION Vy NEW ZEALAND 1978-2011.
Note that in Figure
3, no correction has been applied to Vy for secondary increases in
payment time during recessions or decreases in payment time during economic
boom periods. The maximum correction in Vy appears to be in the
order of +/- 0.3 or up to 1.5%. The series shown is less stable from 1978 to
1989. This is possibly due to distinctly different growth exponentials
1978-1989 arising from the very high interest rates that were typical during those
years.
As shown in Figure 4, My in
Click here to view FIGURE 4 : ESTIMATED TRANSACTION FUNDING My NEW ZEALAND
1990-2011.
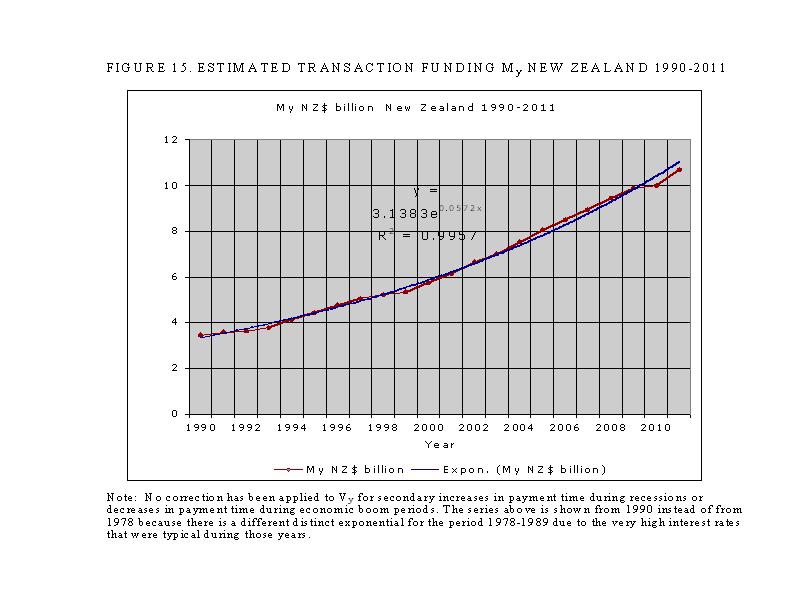
The methodology
used to calculate Vy in Figure 4 is as follows. The GDP in
Businesses pay
suppliers monthly, and indirect payments are usually made on a monthly basis
too, so their speed of circulation is about 12 on average. Most workers get
paid fortnightly (though some get paid weekly and some monthly) so an average
speed of circulation of 26 has been assumed for that.
When the above figures are
weighted the weighted average speed of circulation is (12x(42.7+12.3)+45 x
26)/100 = 18.3.
A similar estimate
of payment trends and a separate Vy calculation was made for each of
the other years, and a polynomial best fit curve was drawn as in Figure
15.
My was
then obtained by dividing the official GDP figure by the speed of circulation
taken off the best fit trend curve. This
gives the data series shown in Figure 5 and used when applying the debt model.
The methodology is
easily replicable using better information about payment trends and is
applicable to any country.
Figure 4 shows the
preliminary estimate for estimated production debt and cash My in
Figure 5 shows an
indicative comparison between the residual debt Ds for New Zealand calculated
from equation (2) and plotted against the model Ms calculated as the
accumulated after tax deposit interest on M3 (excluding repos). The curve for Ms
is a first approximation because assumptions have been made on the average tax
deducted from the gross payments of unearned income (M3 (excluding repos x the
average interest paid on deposits). The
tax is the average tax paid by each income-earner on his or her total income.
It is not the marginal tax rate 54.
The losses from the 1987 share market crash in
Once the tax rates
on Ms have been accurately calibrated, the size of any debt bubble Db
can be immediately calculated.
Measures can then be taken to eliminate the bubble without risking any economic
downturn.
Click here to view FIGURE 5 : BUBBLE DEBT Db AND Ms NEW ZEALAND
1978-2011.
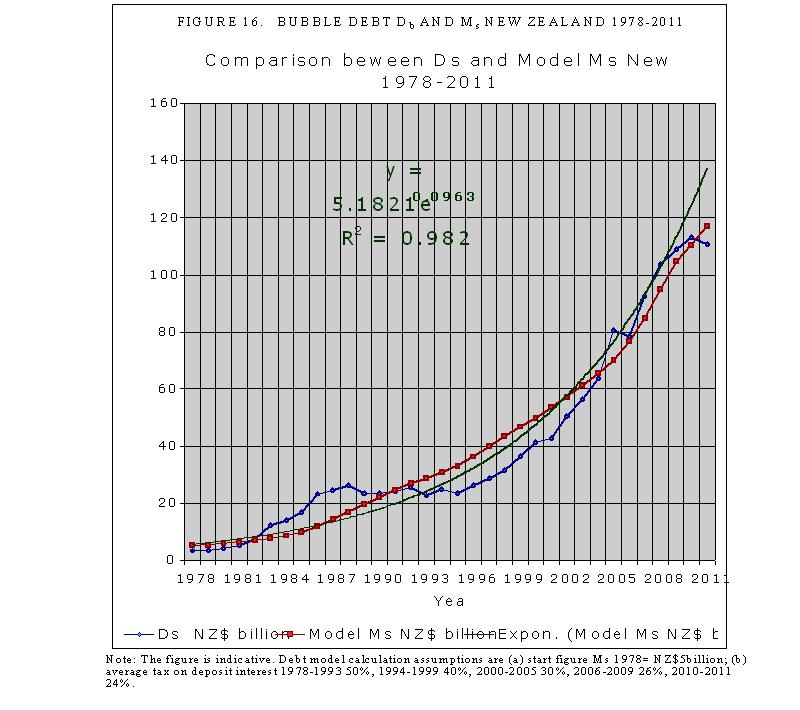
08. APPENDIX 3:
CALCULATIONS FOR TABLE 4.
i) High income family -2 children.
Take
an “upper”
-
GMI NZ$ 670/week (Table 3) x 52 NZ$ 34,840
-
Earned income NZ$ 150,000 x (1-0.415) NZ$ 87,750
- Less
NZ$ 1,000,000 x 1% (NZ$
10,000)
Total NZ$ 112,590
High
income
With
income splitting, one adult earning NZ$ 50,000 and the other earning NZ$
100,000
Their
combined income tax would be NZ$ 31,940 instead of NZ$ 40,240 and the family
would be NZ$ 5,480 worse off instead of NZ$ 3,010 better off.
ii) High family income – no children.
When
the same calculation is applied to a married couple without children, the numbers
change significantly.
-
GMI NZ$ 470/week (Table 3) x 52 NZ$ 24,440
-
Earned income NZ$ 150,000 x (1-0.415) NZ$ 87,750
- Less
NZ$ 1.000,000 x 1%
(NZ$ 10,000)
Total NZ$ 102,190
A
couple in the high household income bracket is NZ$ 7,390 worse off.
With
income splitting, one adult earning NZ$ 50,000 and the other earning NZ$
100,000
Their
combined income tax would be NZ$ 31,940 and the couple would be NZ$ 15,700
worse off instead of NZ$ 7,400 worse off.
iii)
High income – single person household.
When
applied to a single person household on a similar basis the calculation
becomes:
-
GMI NZ$ 350/week (Table 3) x 52 NZ$
18,200
-
Earned income NZ$ 150,000x(1-0.415) NZ$
87,750
- Less
NZ$ 1,000,000 x 1%
(NZ$ 10,000)
Total NZ$ 95,950
The
single person upper income working household with substantial assets loses
about NZ$
iv)
Upper income family -2 children.
Take
an “upper”
-
GMI NZ$ 670/week (Table 3) x 52 NZ$
34,840
-
Earned income NZ$ 100,000 x (1-0.415) NZ$
58,500
- Less
NZ$ 500,000 x 1% (NZ$ 5,000)
Total NZ$ 88,340
Upper
income
With
income splitting, one adult earning NZ$ 33,333 and the other earning NZ$ 66,666
Their combined
income tax would be NZ$ 13,020 instead of NZ$ 23,920 and the family would be
NZ$ 1,360 better off instead of NZ$ 12,260 better off.
v)
Upper family income – no children.
When
the same calculation is applied to a married couple without children, the
numbers change significantly.
-
GMI NZ$ 470/week (Table 3) x 52 NZ$
24,440
-
Earned income NZ$ 100,000 x (1-0.415) NZ$
58,500
- Less
NZ$ 500,000 x 1% (NZ$ 5,000)
Total NZ$ 77,940
A
couple without children in the upper household income bracket is NZ$ 1,860
better off.
With
income splitting, one adult earning NZ$ 33,333 and the other earning NZ$ 66,666
Their
combined income tax would be NZ$ 13,020 instead of NZ$ 23,920 and the family
would be NZ$ 9,040 worse off instead of NZ$ 1,860 better off.
vi)
Upper family income – single person household.
When
applied to a single person household on a similar basis the calculation
becomes:
-
GMI NZ$ 350/week (Table 3) x 52 NZ$
18,200
-
Earned income NZ$ 100,000x(1-0.415) NZ$
58,500
- Less
NZ$ 500,000 x 1% (NZ$ 5,000)
Total NZ$ 71,700
The
single person upper income working household loses NZ$
vii) Average family income -2 children.
Take
an “average”
-
GMI NZ$ 670/week (Table 3) x 52 NZ$
34,840
-
Earned income NZ$ 75,000 x (1-0.415) NZ$
43,875
- Less
NZ$ 300,000 x 1% (NZ$ 3,000)
Total NZ$
75,715
Average
With
income splitting, one adult earning NZ$ 25,000 and the other earning NZ$ 50,000
Their
combined income tax would be NZ$ 11,415 instead of NZ$ 15,670 before the tax
credit is taken into account and the family would be NZ$ 9,163 better off
instead of NZ$ 13,418 better off.
55 Before allowing for any government transfers.
viii) Average
family income – no children.
When
the same calculation is applied to a married couple without children, the
numbers change significantly because there is no tax credit and the income is
$59, 333
-
GMI NZ$ 470/week (Table 3) x 52 NZ$
24,440
-
Earned income NZ$ 75,000 x (1-0.415) NZ$
43,875
- Less
NZ$ 300,000 x 1% (NZ$ 3,000)
Total NZ$
65,315
A
couple on the average household income is still NZ$ 5,982 better off.
With
income splitting, one adult earning NZ$ 25,000 and the other earning NZ$ 50,000
Their
combined income tax would be NZ$ 11,415 instead of NZ$ 15,670, and they would
be NZ$ 1,727 better off instead of NZ$ 5,982 better off.
ix)
Average family income – single person household.
When
applied to a single person household on a similar basis the calculation
becomes:
-
GMI NZ$ 350/week (Table 3) x 52 NZ$
18,200
-
Earned income NZ$ 75,000 x (1-0.415) NZ$
43,875
- Less
NZ$ 300,000 x 1% (NZ$ 3,000)
Total NZ$
59,075
The
single person average income working household is tax neutral.
x)
Lower income family -2 children (a) income 50000.
Take a
“ low”
-
GMI NZ$ 670/week (Table 3) x 52 NZ$
34,840
- Earned income NZ$ 50,000 x (1-0.415) NZ$
29,250
- Less
NZ$ 0 x 1% (NZ$ 0)
Total NZ$ 64,090
Low
income
With
income splitting, one adult earning NZ$ 16,667 and the other earning NZ$ 33,333
Their
combined income tax would be NZ$ 6.790 instead of NZ$ 8,020 before the tax
credit is taken into account and the family would be NZ$ 4,240 better off
instead of NZ$ 5,470 better off.
xi)
Low family income – no children.
When
the same calculation is applied to a married couple without children, the numbers
change significantly because the only addition to the after tax income would
be, say,
NZ$
125/week for the accommodation allowance. For a total income of NZ$ 48, 480.
The GMI offers substantial relief to these very low income households
-
GMI NZ$ 470/week (Table 3) x 52 NZ$
24,440
-
Earned income NZ$ 50,000 x (1-0.415) NZ$
29,250
- Less
NZ$ 0 x 1% (NZ$ 0)
Total NZ$
53,690
A low income couple will be much better off by
about NZ$ 5,210/year.
With
income splitting, one adult earning NZ$ 16,667 and the other earning NZ$ 33,333
Their
combined income tax would be NZ$ 6,790 instead of NZ$ 8,020 and the couple
would be NZ$ 3,980 better off instead of NZ$ 5,210 better off.
xii)
Low income – single person household.
When
applied to a single person household on a similar basis but with the
accommodation allowance at NZ$ 100/week present total income is NZ$ 47,180: the
calculation becomes:
-
GMI NZ$ 350/week (Table 3) x 52 NZ$
18,200
-
Earned income NZ$ 35,000 x (1-0.415) NZ$
29,250
- Less
NZ$ 0 x 1% (NZ$ 0)
Total NZ$
47,450
The
single person low income working household is tax neutral.
xiii) Bottom
income family -2 children (a) income 35000.
Take a
“very low”
-
GMI NZ$ 670/week (Table 3) x 52 NZ$
34,840
-
Earned income NZ$ 35,000 x (1-0.415) NZ$
20,475
- Less
NZ$ 0 x 1% (NZ$ 0)
Total NZ$ 55,315
Very
low income
With
income splitting, one adult earning NZ$ 11,667 and the other earning NZ$ 23,333
Their
combined income tax would be NZ$ 4,328 instead of NZ$ 5,145 before the tax
credit is taken into account and the family would be NZ$ 4,311 better off
instead of NZ$ 5,128 better off.
xiv)
Bottom family income – no children.
When
the same calculation is applied to a married couple without children, the
numbers change significantly because the only addition to the after tax income
would be, say, NZ$ 125/week for the accommodation allowance. For a total income
of NZ$ 36,355. The GMI offers substantial relief to these very low income
households.
- GMI NZ$ 470/week (Table 3) x 52 NZ$
24,440
- Earned income NZ$ 35,000 x (1-0.415) NZ$
20,475
- Less
NZ$ 0 x 1% (NZ$ 0)
Total NZ$
44,915
A very
low income couple will be much better off by NZ$ 8,560/year.
With
income splitting, one adult earning NZ$ 11,667 and the other earning NZ$ 23,333
Their combined
income tax would be NZ$ 4,328 instead of NZ$ 5,145 and the couple would be NZ$
7,743 better off instead of NZ$ 8,560 better off.
xv)
Bottom income – single person household.
When
applied to a single person household on a similar basis but with the
accommodation allowance at NZ$ 100/week present total income is NZ$ 35,055: the
calculation becomes:
-
GMI NZ$ 350/week (Table 3) x 52 NZ$
18,200
-
Earned income NZ$ 35,000 x (1-0.415) NZ$
20,475
- Less
NZ$ 0 x 1% (NZ$ 0)
Total NZ$
38,675
The
single person very low income working household is NZ$ 3620 better off.
09. BIBLIOGRAPHY.
Allsopp C & Vines D, (2008) “Fiscal policy, intercountry adjustment
and the real exchange rate in
Baker D (2008), “The Benefits of a Financial Transactions
Tax” Center for Economic and Policy Research,
December 2008.
Bertram G (2009), “The Banks, the Current Account, the Financial Crisis
and the Outlook”, Policy Quarterly, Vol. 5 Issue 1, February 2009.
Brand C (2010), “Commission Calls for Tax on
Financial Transactions”, 6/April/2010.
Brash D (1996), . New Zealand and international
financial markets: have we lost control of our own destiny?” Address by Donald T Brash, Governor of the
Reserve Bank of New Zealand to the 31st Foreign Policy School,
University of Otago, Dunedin, 29th
June 1996.
Fisher I (1930) “The Theory of
Interest”
George H (1879) “An inquiry into the cause of
industrial depressions and of increase of want with increase of wealth... The
Remedy” Self published in
Manning L (2009), “The Ripple Starts Here: Finishing the Past 1694-2009”, New
Zealand Association of Economists 50th Anniversary Conference July
1-3 2009, as published under a creative commons licence at www.integrateddevelopment.org.
Manning L, (2010) “The Interest-Bearing Debt System and its Economic
Impacts” Version 3, 18 August, 2010,
Sustento Institute, Christchurch NZ as published under a creative
commons licence at www.integrateddevelopment.org.
Obstfeld M (1998), “The Global Capital market: Benefactor or Menace?”
Draft April 27 1998.
Preston D
(2009), “Putting Credit back into
Monetary Policy: Reconstructing the New Zealand Monetary Policy Framework”,
Paper for NZ Association of Economists 50th Anniversary Conference,
July 1-3 2009.
Rose D (2009), “Overseas Indebtedness, Country Risk and Interest Rates”,
Policy Quarterly, Vol. 5 Issue 1, February 2009.
Unknown authors, (ca. 2000) “Alternative monetary policy
instruments”.
MORE ON MONETARY REFORM :
NEW Capital is debt.
NEW Comments on the IMF (Benes and
Kumhof) paper “The Chicago Plan Revisited”.
DNA of the debt-based economy.
General summary of all papers
published.(Revised
edition).
How to create stable financial systems in four
complementary steps. (Revised edition).
How to introduce an e-money financed virtual minimum wage
system in New Zealand. (Revised edition) .
How
to introduce a guaranteed minimum income in New Zealand. (Revised edition).
Interest-bearing debt system and its economic impacts.
(Revised edition).
Manifesto of 95 principles of the debt-based economy.
The Manning plan for permanent debt reduction in the national economy.
Missing links between growth, saving, deposits and
GDP.
Savings Myth. (Revised edition).
Unified text of the manifesto of the debt-based economy.
Using a foreign transactions surcharge (FTS) to manage the
exchange rate.
(The
following items have not been revised. They show the historic development of
the work. )
Financial system mechanics explained for the first time. “The Ripple
Starts Here.”
Short summary of the paper The Ripple Starts Here.
Financial system mechanics: Power-point presentation.
Return to : Bakensverzet homepage
"Money is not the key that opens the gates of the market but the
bolt that bars them."
Gesell, Silvio, The Natural Economic Order, revised English edition,
Peter Owen,
![]()
This
work is licensed under a Creative Commons
Attribution-Non-commercial Share-Alike 3.0 Licence.