NGO Another Way
(Stichting Bakens Verzet), 1018 AM
SELF-FINANCING,
ECOLOGICAL, SUSTAINABLE, LOCAL INTEGRATED DEVELOPMENT PROJECTS FOR THE WORLD’S
POOR
|
FREE
E-COURSE FOR DIPLOMA IN INTEGRATED DEVELOPMENT |
|||||
Edition 02: 18 November, 2010.
Edition 04 : 08 August, 2011.
Revised edition 05 : 22 August, 2011.
Edition 08 : 09 February, 2013.
(VERSION EN FRANÇAIS PAS DISPONIBLE)
Information on
monetary reform :
Summaries of monetary reform
papers by L.F. Manning published at http://www.integrateddevelopment.org
NEW Capital is debt.
NEW Comments on the IMF (Benes and Kumhof) paper “The
Chicago Plan Revisited”.
DNA of the debt-based economy.
General summary of all papers published.(Revised edition).
How to create stable financial systems in four
complementary steps. (Revised edition).
How to introduce an e-money financed virtual minimum wage
system in New Zealand. (Revised edition) .
How
to introduce a guaranteed minimum income in New Zealand. (Revised edition).
Interest-bearing debt system and its economic impacts.
(Revised edition).
Manifesto of 95 principles of the debt-based economy.
The Manning plan for permanent debt reduction in the national economy.
Missing links between growth, saving, deposits and
GDP.
Savings Myth. (Revised edition).
Unified text of the manifesto of the debt-based
economy.
Using a foreign transactions surcharge (FTS) to manage the
exchange rate.
(The
following items have not been revised. They show the historic development of
the work. )
Financial system mechanics explained for the first time. “The Ripple
Starts Here.”
Short summary of the paper The Ripple Starts Here.
Financial system mechanics: Power-point presentation.
THE
INTEREST-BEARING DEBT SYSTEM AND ITS ECONOMIC IMPACTS.
By
Sustento
Institute
We are
almost blind when the metrics on which action is based are ill-designed or when
they are not well understood 01 .
01 Stiglitz et al 2009 p9.
Key Words: accumulated current account deficit, CPI,
current account deficit, debt, debt model, debt growth, deposit interest,
domestic credit, exponential debt growth, Fisher equation, inflation, national
accounts, revised Fisher Equation, structural debt growth, systemic debt
growth, systemic inflation, unearned income.
CONTENTS:
EXECUTIVE
SUMMARY.
01. INTRODUCTION.
02. The
DEBT PROBLEM.
03. The
simple economy.
04. The unsustainable
economy.
05. The
unsustainable economy with foreign debt.
06. The
debt model.
07. Systemic
Inflation AND INFLATION POLICY.
08. THE
DEBT EXPLOSION AND FINANCIAL STABILITY.
09. CULTURE
AND INSTITUTIONS.
10. CONCLUSIONS.
11. BIBLIOGRAPHY.
12. ACKNOWLEDGEMENTS.
EXECUTIVE SUMMARY.
This paper shows how debt evolves in the
interest-bearing debt-based financial system and why debt growth is
exponential. It analyses the fundamental
mechanisms of debt growth and provides a sound theoretical base to support the
analysis. The theoretical foundation is a revised form of the Fisher Equation
of Exchange that, for the first time, takes the structural effects of interest
bearing debt on the financial system into account.
Some earlier work [such as Snyder, (1940);
Danks/Social Credit (1955); Friedman, (1962)]
may at a superficial first glance appear to have some common grounds
with the analyses set out in this paper. This is not so. The only common ground
of this paper with the cited works is that it supports a quantitative approach
to the supply of money and credit in the economy. With some exceptions, mostly relating to war
and economic crises, the world’s money supply has always been based on the quantity
of money rather than the price of money.
The change to a price-based monetary system
accelerated after US President Nixon abandoned the
This paper shows how the price of money paid as
interest on deposits in the banking system produces a pool of unearned income that
causes self-reinforcing exponential debt growth.
The price-based financial system has not
prevented economic growth around the world, but that growth has come at
incalculable human and environmental cost. It has led to economic, political
and environmental instability and a widening gap between rich countries and
poor countries as well as between rich and poor within countries.
The figures given in the paper are preliminary.
They suggest that price-based debt expansion in developed economies is gradually
becoming unstable. The gross cost of
paying interest on the pool of unearned income Ms is about twice the systemic inflation in the
economy. Were it not for taxation on interest,
The immediate effects of crises like the current
one in New Zealand are large-scale loss of “savings “ (S in the debt
model) and equity, reduced incomes and
purchasing power in the productive economy
with associated job losses, growing income inequality and a declining
quality of life.
The paper shows that the current price-based
financial system based on interest bearing debt is self-destructive. It will
destroy the global economy unless it is changed. The world must return to a
financial system based on quantitative principles that remove or at least
reduce to a minimum the growth of unearned income that is causing the
unsustainable debt growth.
01: INTRODUCTION.
Recent financial crises around the world,
beginning in the
In recent decades, thousands of learned papers
and articles have been written about the phenomenon of rapidly expanding debt
but little work has been done on debt growth from a structural or systemic
point of view. Credit expansion has long been seen as a function of the demand
for new credit moderated predominantly by its price, the risk perception of the
borrower by the lender, the reserves financial institutions have to hold to
manage their lending risks and, in some cases, deposit withdrawals.
There is now overwhelming evidence to suggest
the existing debt management system is dysfunctional. The best efforts of the
world’s monetary authorities have failed to prevent excessive debt growth. Debt
levels have continued to expand much faster than measured nominal economic
output despite periods of turmoil in the world economy, high or low interest
rates, widespread changes in financial regulation and even bank bailouts. This
suggests a more fundamental cause of debt growth exists outside the present
financial architecture that has either been taken for granted or overlooked by
existing economic theory and practice.
This paper will explore the underlying causes of
rapid debt growth and what can be done to prevent excessive debt growth in the
future. Later papers will examine other initiatives that might then be taken to
improve
Section 2 of the paper proposes that debt growth
in modern debt-based economies is predominantly caused by the generation of
unearned income in the form of interest paid on bank deposits 03. Modern developed countries operate on a
debt-based financial system whereby nearly all deposits arise from borrowing
debt at interest through the banking system.
The paper shows how unearned income arising from the payment of interest
on deposits causes exponential debt expansion 04.
02 Arguably Northern Rock in the
03 Earned income is the income generated from
the production of goods and services that form part of the Gross Domestic
Product (GDP). Unearned income is income arising from the payment of interest
on bank deposits that is unproductive and does not add to GDP.
04 The decision whether to save or invest
unearned income depends on the real interest rate (the difference between the
interest rate paid and inflation) and the perceived risk weighted financial
returns available in the investment sector. If real interest rates are very
low, as in
To test the unearned income hypothesis, Section
3 models a simple economy. Figure
Section 4 examines the economic transformation
that occurs when deposit interest is introduced into the simple economy model
shown in Figure 1. In Figure 2, deposit
interest in the form of unearned income introduces inflation into the model and
also stimulates debt growth, thereby proving the basic hypothesis linking
deposit interest to debt growth.
Equations are provided to show the debt growth is exponential. The
analysis of Figure 2 shows that debt expansion and inflation are both readily
quantifiable, and it demonstrates why, in practice, almost all price is
inflation 05. Figure 2 shows
how the pool of unearned income arises incrementally from payment of interest
on bank deposits but, in aggregate, remains outside it. The increment of
unearned income from each production cycle is permanently transferred to the
investment sector while the debt giving rise to it remains a burden on the
productive sector.
Section 5 describes what happens when a country
such as
Having proven the main thesis about debt growth,
theoretical support for it is offered in Section 6 by introducing a new debt
model that has been derived from Irving Fisher’s well-known Equation of
Exchange that dates back to 1912 (Fisher, 1912, Manning, 2009). The revised
Fisher Equation supersedes the original Fisher Equation of Exchange because it
takes into account the growth of an independent investment sector based on
unearned deposit income 06. My* Vy mirrors MV in Fisher’s original equation, which didn’t take into account
the effect of interest-bearing debt. The paper shows how debt interest is
compounded exponentially.
05 The simple economy of Figure 1 has very
little if any inflation while in the economy shown in Figure 2 inflation
in the productive economy is linked directly to the deposit interest
rate. Figure 3 shows how total inflation
has accelerated as developed economies have become more and more dependent on
interest-bearing debt. This paper proposes that nearly all the inflation shown
in Figure 3 arises from unearned deposit interest so that in practice all price
arises from inflation.
06 Quite the opposite of previous work (such
as Snyder, 1940) whose early support for monetarism was based on empirical
statistical analysis.
In the following Section 7, an entirely new
concept of systemic inflation is
discussed in some detail. In the debt
model annual systemic inflation is roughly 0.5*(M3 minus repos)* I*K caused by the
interest rate I% paid on deposit interest and K is (1 – the tax rate T paid on
the gross deposit interest). The study shows there is no mechanism within the
existing debt-based financial system to directly manage inflation and that
orthodox interest rate policy works through the debt servicing requirements of
the investment sector. It establishes two primary concepts:
-Individually it is possible to save debt-free
money but in aggregate, it appears difficult, if not impossible, to save earned
income generated from debt.
Conceptually, from Figures 2 and 4, non-productive “saving” in the debt
system reduces the money available for consumption, resulting in either a fall
in prices or a fall in consumption. In practice consumption usually falls much
faster than prices because incomes are “sticky” 07. Earned savings 08 therefore tend
to produce a loss of consumption capacity from the productive economy unless
they are replaced by net non-income capital borrowing and consumer debt 09, Db in the revised Fisher Equation of Exchange.
- Inflation in the existing debt system is
systemic and unavoidable. Orthodox interest rate policy only briefly suppresses
systemic inflation at great economic cost to the real productive economy and
the wider community.
Section
8 sets out the historical debt growth in
Instead
of being used for consumption where it would cause rampant inflation as it is
represented by systemic inflation .
Section
9 contains a brief review of the way culture and institutions have contributed to
the lack of awareness of the issues addressed in this paper.
The
overall conclusions from the paper are that unearned income in the form of
deposit interest is the direct cause of the problem of excessive debt, and that
consequently, debt growth and its accompanying systemic inflation can only be
managed effectively by greatly reducing and preferably removing the payment of
interest on bank deposits.
Section 8 sets out the historical debt growth in
Section 9 contains a brief review of the way
culture and institutions have contributed to the lack of awareness of the issues
addressed in this paper. Historically,
The overall conclusions from the paper are that
unearned income in the form of deposit interest is the direct cause of the
problem of excessive debt, and that consequently, debt growth and its
accompanying systemic inflation can only be managed effectively by greatly
reducing and preferably removing the payment of interest on bank deposits. In
the absence of multilateral agreements 12 to reduce or eliminate
deposit interest, unilateral action is feasible 13 but it requires
carefully constructed financial instruments to manage cross border capital
flows 14.
07 “Sticky” is the term used in economics to
describe resistance to downward pressure on variables like incomes and prices.
For example, wages are “sticky” because it is very difficult in many countries
to lower them once they have been increased.
08 Not to be confused with savings arising from
UNEARNED income referred to above.
09 As happened in the United States where
until recently consumption was maintained by growing household and consumer
debt until consumers became debt-saturated and could no longer meet their
debt-servicing obligations as discussed briefly in section 4 of this paper.
10 See Figure 11. The incentive to invest is
(M3 minus repos)*I*K/GDP(d) – Inflation% where I is the interest rate on
deposits and K is (1-the tax rate on interest). When I =0 there would be little
incentive to invest other than human nature. Man has always “saved for a rainy
day” and that would continue. When I is close to zero there will be little or
no inflation.
11 There was arguably a housing bubble but that
arose directly from the mechanics of the debt system as described in this paper
and not from speculative debt (see paper section 6 and Db in the debt
model)
12 For example, through the Bank for
International Settlements, the International Monetary Fund and the World Bank.
13 As will be shown in Papers 2, 3 and 4 of
this series.
14 The situation is different for different
countries.
02. THE DEBT
PROBLEM.
The interest-bearing debt financial system in
use all over the world today evolved from the fear King William III of England
had in 1694 for the wrath of his subjects were he to increase their taxes to
pay for his wars in Europe. Afraid of a
political backlash and bereft of the will to responsibly address his financial
difficulties, King William borrowed from a group of wealthy citizens. In doing
so, he put off the day of reckoning by pledging future taxes in perpetuity to
fund his debt. Future taxes had to be pledged because previous experience had
taught lenders the Crown was not fully creditworthy 15. The lending
arrangements were written into law in the Tonnage Act of 1694. By that means
“modern” banking was born in the form of the Bank of England. Since then, debt
expansion has gradually accelerated, more recently aided by increased
automation within the banking sector and on-going financial deregulation. The point has now also been reached where the
role cash transactions play in generating measured economic activity has all
but been eliminated in the developed western economies. That has happened
despite the fact that cash, being debt free and interest free, provides a
continuous and costless means of exchange as long as it is in circulation.
Instead, cash has progressively been replaced by expensive interest-bearing
debt created for profit by the commercial banking system 16. In most developed countries, cash makes
up 3% or less of the broad money supply,
and much of that circulates outside the productive economy 17.
Unlike the famous greenbacks printed and spent into circulation by the
15 The previous King, James II, defaulted on
his debt ruining many of those who had lent him money.
16 The elimination of cash is quite recent. In
17 In the “black” unmeasured economy for
example, such as drugs, gambling and other illicit activities. In
18 The central bank/treasury makes a profit
from selling notes and coins that cost much less than their face value to
produce. The profit is called
seigniorage.
Many trillions of dollars of interest-bearing
debt are now being added to the world’s economies every year. It is now widely
acknowledged such rapid debt growth is unsustainable because debt costs are absorbing
a disproportionate and growing share of earned incomes. The existing monetary
authorities have proved incapable of managing debt growth short of financial
collapses such as the one that occurred during the recent worldwide crisis that
began in 2007. Logically, if the present financial system is unable to cope
with excessive debt growth, there must be some other mechanism at work that
does not fall within existing economic theory.
This paper proposes the alternative view that
debt growth in modern economies is predominantly caused by unearned income in
the form of interest paid on bank deposits 19. The paper shows that
whenever interest is paid on deposits a corresponding debt is created somewhere
else, usually in the productive economy.
That makes most of the debt giving rise to deposit interest a structural part
of the productive economy. The interest has to be paid by the productive
economy or from asset inflation and must be included in prices. The only ways to keep prices stable when
interest is being paid on deposits are to increase productivity or to reduce
disposable incomes 20.
In the debt system the debt is created before
its corresponding money deposit 21. Since unearned deposit income
cannot come out of thin air it must arise from new debt. Without new debt there
can be no new money. Paying unearned income in the form of deposit interest
demands that new debt be created within the productive economy to fund it.
Otherwise deposits in the productive economy would keep falling 22
as they are transferred from the productive sector to the investment sector or
paper economy. In the debt system there isn’t enough money in the productive
economy to pay depositors interest on their deposits, unless it is first created
into existence to pay to them. As long as unearned income deposits continue to
increase, so must their corresponding debt be carried as a permanent burden
either in the productive economy or through asset inflation. The generation of
new debt in the productive economy has been growing beneath the modern economic
radar screen for many decades. If this new view of debt growth can be proved to
be correct, either a way must be found to slow or stop paying interest on
deposits or the world’s debt-based economies must face imminent financial
collapse as the debt servicing demands become unsustainable in the productive
economy.
In practice the collapse has already begun in
the
Some readers may at first sight see some
similarity between parts of this paper and earlier proposals 23
supporting the inflationary issue of interest-free credit. This analysis,
especially section 4 of this paper clearly demonstrates that is not the case.
19 Deposits and debt go together but they are
not the same. For every dollar of debt there is a dollar deposit somewhere.
First someone signs a loan (debt) agreement with the bank. When the loan is
drawn down (activated), a corresponding deposit is entered into the borrowers
account. The debt (loan) and the deposit are numerically equal but the debt is
an asset in the bank’s books and the corresponding deposit is a liability in
the bank’s books. Deposit interest usually, though not always, makes up a large
part of the interest borrowers pay on their loans. Loan interest = Deposit
interest + the bank margin or spread.
20 Raising interest rates to manage inflation
causes a reduction in consumption capacity (Manning, 2009)
21 The loan agreement with the bank always
precedes the deposit appearing in the borrowers account.
22 This would produce a deflationary spiral in
the productive economy because there would be less money circulating there to
produce the same amount of goods and services.
23 Such as C.H. Douglas’ ideas on
social credit
03. THE SIMPLE ECONOMY.
The
first step in revealing how the present debt system works is to show how a
simple debt economy can function without large-scale
debt expansion and without deposit interest 24. It’s close to the
way economies used to work when they were based on cash rather than debt.
The
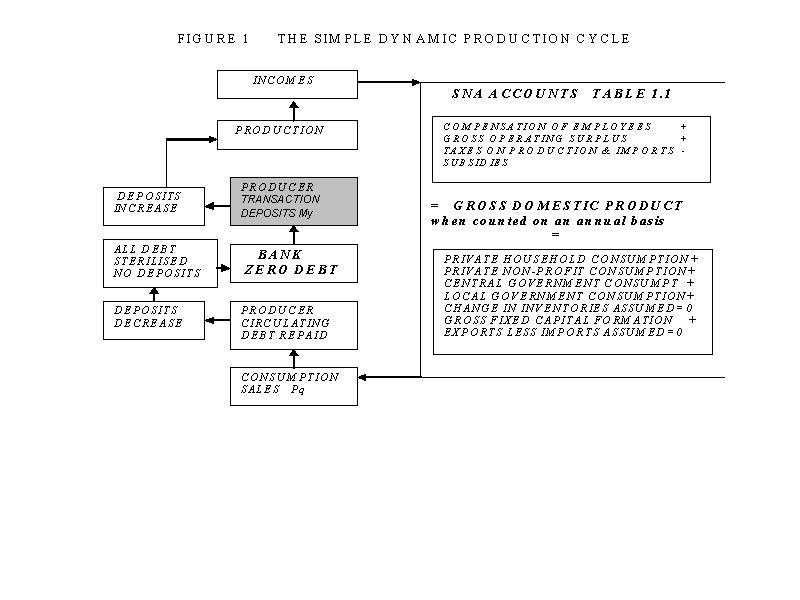
simple dynamic debt economy is shown in Figure 1. Figure 1 satisfies the
international System of National Accounts (SNA) in use worldwide except that it
assumes for simplicity that a country has a balanced international trade
account and that business inventories are stable.
The
first step in revealing how the present debt system works is to show how a
simple debt economy can function without large-scale
debt expansion and without deposit interest. It’s close to the way economies
used to work when they were based on cash rather than debt.
The
simple dynamic debt economy is shown in Figure 1. Figure 1 satisfies the
international System of National Accounts (SNA) in use worldwide except that it
assumes for simplicity that a country has a balanced international trade
account and that business inventories are stable.
Click here to see FIGURE 1 :THE SIMPLE DYNAMIC PRODUCTION CYCLE.
Conceptually,
there is no residual debt after any individual production cycle, and no
residual deposits. Each cycle in Figure 1 is self-clearing and the debt is self
–cancelling 25. Nor can there be any aggregate earned savings 26. If there were, the cycle would not be self-clearing.
Inventories would change and/or prices P would change and/or output q would
change. In sum, what is produced is sold,
including new capital goods. Figure 1 allows for the transaction deposits My to change over time and for
prices P and output q to also change according to the institutional rules in
place for the time being, productivity growth and population changes. As
described below, the simple model in Figure 1 does not need to make specific
provision for a “market” in existing capital goods or for their progressive
depreciation over time. In practice, the basic production cycle doesn’t
literally “pulse” as shown in Figure 1. Instead there is an ongoing stream of
production and consumption, a corresponding quantum of transaction deposits My continuously in circulation
and an equivalent quantum of deposits always in bank accounts.
24 The simple model economy assumes that no interest is
paid to depositors on the account balances.
25 Interest on any production debt is included in both
the income (production) and consumption sides of Figure 1 and so is self
cancelling, but increases in interest (bank spread) will lead to cost inflation
and vice versa.
26 For each individual who has “earned
savings” others must carry a corresponding amount of consumer debt.
It does not matter how many transactions there
are in a production chain, or when they take place 27. Each transaction follows the
cycle shown in Figure 1.
The
production cycle shown in Figure 1 uses the transaction deposits My to produce capital goods as
well as goods and services for consumption. The capital goods make up the
“Gross Fixed Capital Formation” shown in SNA Table 1.1 on the lower right in
Figure 1. Figure 1 assumes the producer of a capital good sells it to other
existing deposit holders for the time being, so its purchase price comes out of
employee incomes and the gross operating surplus. The banking system
intermediates among deposit holders to enable such exchanges of capital goods
to take place. The borrower repays loan
principal by transferring future income to the lender. The lender can then
consume the repayment or re-lend its purchasing capacity to others who wish,
for the time being to consume more than they earn. Such arrangements are a matter of agreement
between the parties and will usually include the payment of interest. Such
payments are like borrowing from a non-bank finance company. They involve a
transfer of wealth (future income) from the borrower to the lender but they do
not affect the total amount of bank deposits.
There is no inconsistency between the interest-free system of Figure 1
and the idea that willingness to delay consumption is “worth” an interest
premium.
In the
absence of interest on deposits, the system is in balance and there is no inflation.
A
capital good would typically be put to good productive use to generate
additional income in subsequent production cycles. The transaction deposits My, incomes, the gross operating
surplus and q would all rise to accommodate the real growth from new capital
goods so repayments could be made from the economic expansion. That’s why, as
shown in Figure 3, there was no inflation in
27 Danks (1955) pp. 12-15
28 In some
countries, investment banking became widespread, pooling cash and deposits to
fund capital investments such as rail, shipping and other industrial expansion.
Sales
and transfers of capital goods mean the banking system is left with debtors and
creditors in like amount at the end of the production cycle when My is conceptually
cancelled. That distributive effect
leaves some players in the economy with net deposits and some with net debts,
and that, as will be shown below, is where the problems with systemic debt
expansion begin as soon as interest is paid on system deposits.
In an
interest-free environment, the chains of transactions needed to make productive
investments in infrastructure, whether public or private, are the same as those
shown in Figure 1. Investment in infrastructure made by a government or other
public body is traditionally funded from taxation. If there are sufficient
labour and material resources available, it could also be funded using new
producer transaction deposits My within the context of Figure 1.
In that case repayments are typically met in the form of (sometimes
extra) taxes and levies. Since in Figure 1 the cost of such goods and services
are stable, they are known. Private contractors bid against each other for
public work. They do this on the basis of technique, method, and organisation.
Contrary to what some authors might seek to suggest (Danks, 1955), there is no
conflict in such cases between private enterprise and an interest-free economy.
29
The
story is a little different for unproductive capital goods such as
residential housing where the capital expenditure does not increase production beyond
the construction phase. Aside from increasing their work efficiency or working
longer hours, most homebuyers have to pay for their home from their future
earnings or by realising capital gains because they lack a new independent
income stream to pay for the capital good. This greatly accentuates the
distributive effect already referred to because residential homebuyers become
heavily indebted to other players in the economy 30. Until about 200 years ago
housing formed only a small part of economic activity. Since then, and
particularly during the twentieth century, housing expectations in modern
economies have risen sharply to the point where, in
Despite
the various issues around capital goods, the simple economy works very well,
especially where appropriate income redistribution is used to ensure a socially
acceptable level of housing is affordable to all.
People
all over the world owned property, borrowed and loaned money and successfully
conducted all manner of economic transactions long before interest was
routinely paid on bank deposits (Danks, 1955) 32. Payment of interest on bank deposits relates
to the structure of the debt system itself, not to interest-bearing contractual
obligations between consenting parties where one party chooses to defer
consumption and another chooses to buy the use of that party’s consumption
capacity 33 . Reducing or removing interest on deposits
would reduce or eliminate inflation, leading to stable rents and prices 34.
29 Danks, (1955) pp 48-51.
30 The
quantum of residual debt is readily quantifiable but outside the scope of this
paper.
31 Source: Statistics New Zealand Household
Economic Survey (income) June 2009.
32 Danks, (1955) pp 57-58.
33 As discussed later in the paper, the system presently
requires banks to compete for deposits but that competition would still be
possible in the absence of deposit interest.
34 Investment resource allocation would still
be based on cost-benefit analyses exactly as happens now, but with the benefit
that finance charges would play a smaller part in “efficient” allocation. In
addition, other instruments such as variable reserve ratios are available to
central banks to restrain demand for bank lending.
04. THE UNSTABLE ECONOMY.
Having
isolated the broad fundamental problem of debt and shown how a very low- debt
simple economy can function (without inflation), the next step is to explore
how the present system using deposit interest is structured and what causes
exponential debt growth.
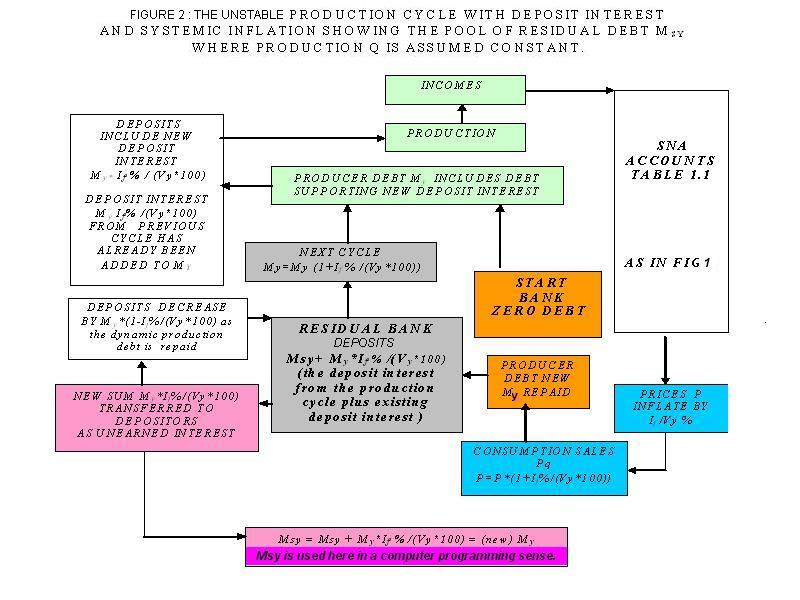
The only
difference between the stable simple economy shown in Figure 1 and the unstable
economy shown in Figure 2 is the introduction of deposit interest on all bank
deposits arising from debt 35 . If Figure 2 demonstrates conclusively how debt
expands exponentially when interest is paid on deposits, then it necessarily
follows that the cause of unsustainable debt growth lies in the payment of
deposit interest.
![]() The introduction of
deposit interest If% 36 produces systemic
changes throughout the economy. In Figure 2, to enable all production to be
consumed, producers must first borrow
(and then pay out in the form of incomes) the deposit interest through
the production phase of the production cycle and then recover it by way of
increases in their prices during the consumption phase. Incomes are assumed to
keep pace with inflation. Otherwise the production cycle cannot clear itself.
The introduction of
deposit interest If% 36 produces systemic
changes throughout the economy. In Figure 2, to enable all production to be
consumed, producers must first borrow
(and then pay out in the form of incomes) the deposit interest through
the production phase of the production cycle and then recover it by way of
increases in their prices during the consumption phase. Incomes are assumed to
keep pace with inflation. Otherwise the production cycle cannot clear itself.
When
each production cycle is cleared there is residual debt and corresponding
residual deposits as shown toward the bottom left of Figure 2. Those deposits take on a life of their own
because they are reinforced by every subsequent production cycle but exist
outside it. The pool of deposit interest plays no further part in production.
Instead, it makes up what is usually called the investment sector or paper
economy that includes the non-trade sector and derivatives market. Deposit
interest acts as a debt pump, pumping more and more deposits into the
investment sector Ms while leaving the corresponding debt in the productive
sector. The investment sector is what creates the inflationary “market” in
existing assets. The deposit Ms supporting the investment sector Ds is un-repayable because it
represents unproductive unearned deposit interest that resides outside the productive
sector.
It does
not matter how many transactions there are in a production chain, or when they
take place 37. Each transaction
follows the cycle shown in Figure 2. There is no inconsistency between the
deposit interest based system of Figure 2 and the idea that willingness to
delay consumption is “worth” an interest premium.
Figure
2 does not directly specify who in the economy has the deposits and who has the
corresponding debt at the end of the production cycle (lower centre of Figure 2). However, net deposit holders emerge from the
redistribution of debt arising from the purchase of capital goods as already
discussed in relation to the simple economy in Figure 1. The production cycle
itself remains a zero-sum game but in Figure 2 the cycle is constantly being
loaded with the extra debt needed to pay the deposit interest (unearned income)
on the investment sector Ms. In addition, when interest-bearing debt is used as in Figure 2 the
consequential transfer of wealth that takes place is accelerated in comparison
with the stable economy of Figure 1
(Danks, 1955) 38.
35 The analysis in this paper uses the average
funding (deposit interest) rate counted over all of the domestic credit. The
average funding rate for
36 Net deposit interest after tax is I*K where K is (I –
tax rate on gross deposit interest).
37 Danks, (1955) op cit pp. 12-15.
38 Danks, (1955) op cit p. 12.
It
should be stressed that ownership of productive infrastructure is irrelevant
from a national macro-economic point of view. Who owns what depends on
political choice. In the case of publicly owned productive infrastructure, the
benefits of the investment are distributed directly amongst the population.
They may for example take the form of shorter travelling times for all
(tunnel), improved education facilities (school), or improved public health (a
sports centre). Where infrastructure is privately owned, the temptation to
charge users for services may be greater and the resulting profits may
accumulate in the hands of a few.
The
investment sector funded by the accumulated interest paid on bank deposits
produces nothing itself. It is paid for
through inflation of the productive sector and from realised capital gains.
Neither
the SNA (System of National Accounts) nor Figure 2 provides any direct
mechanism to enable increases in interest rates to reduce inflation. Interest
rate policy works through borrowers (such as home mortgage holders), the
holders of the Ds debt that supports
the accumulated deposit interest on bank deposits. Raising interest rates
typically increases their interest payments on mortgage and other debt, and
thereby reduces their purchasing power. Raising interest rates to “manage”
inflation, as is commonly done under orthodox economic policy, transfers even
more consumption capacity from the productive economy to unearned income for
deposit holders in the investment sector 39.
39 The quantum can be estimated from equations
1-3. On an annual basis it is roughly the change in the deposit interest
rate*K* (the domestic credit (Ddc). At the moment, based on the Model
calibration for
Figures
1 and 2 provide an alternative insight into the real productive economy. The
orthodox view is that people and firms borrow to invest on the basis their
financial return will exceed their costs including interest. Their net profit
after tax is often put in the bank and the holders of those banked profits then
expect to be paid interest on it. Figure 2 shows such deposits (or other earned
“savings”) by their nature force others in the economy into new debt to replace
those savings in the economy if production and consumption levels in the
economy are to be maintained. Figure 2 also shows that any deposit interest
paid on those “savings” deposits increases My and inflationary pressure in
the productive economy. This is discussed further in section 7 of this paper
where it is proposed that traditional “savings” as set out in the System of
national Accounts (SNA) represent the difference between increases in consumer
debt plus new bank debt for the purchase of capital goods on the one hand and
principal repayments relating to previously purchased capital goods on the
other. As shown in section 6 of this paper, those “savings” are typically
offset by the bubble debt Db in the revised Fisher Equation of Exchange. When interest rates are
increased to manage inflation the higher deposit interest is not (immediately, anyway) compensated in wages
and other incomes. In effect, producers and income earners are forced to gift
to investors “savings” they do not have.
Click here to view FIGURE 2 :THE UNSTABLE PRODUCTION CYCLE.
In
Figure 2 the reduction of consumers’ purchasing power forces prices P down. The
large-scale collateral damage from the loss of consumers’ purchasing power is
that production q in Figure 2 falls in turn, leading to unemployment and
recession.
Deposit
interest prevents the efficient functioning of the economy unless the
interest is fully compensated in
employee incomes and the gross operating surplus. Orthodox economic policy
typically fails to match incomes to inflation because of arbitrary limits
placed upon measured CPI (Consumer Price Index) inflation. Such mismatches
create the boom and bust features so typical of modern business cycles as
interest rates change. They also accentuate the drift of wealth away from wage
and salary earners towards the holders of deposit interest.
The key
to understanding Figure 2 is that only that part of the domestic debt that is
not already committed as Ds to fund the unearned income pool
or to Db as “savings” is available for
use in the productive economy.
Debt
can only be used once. If the debt Ds is used to support
the pool of unearned deposit income it cannot also be used to fund the
production cycle unless the corresponding Ms deposits are directly
re-invested in new production or productive capital goods.
In
aggregate, re-investment of deposits arising from the debt Ds into the production cycle is
not common, in part because there is a financial incentive (discussed later)
for them to remain in the investment sector, and in part because saving is
instinctive. People have always saved. Instead, holders of unearned income
deposits tend to find the investment “game” more profitable, trying to increase
their share of those deposits by trading among each other in existing capital
goods such as equities, property and financial derivatives. Figure 2 shows that
the investment sector debt creates an exponential expansion of unearned income
Ms given by the
expressions (based on annual figures) 40
Ms1
= Ms0*(I+I1*K1)+11*(My1*Vy1)*K1
where Ms0 = 0 (1)
Ms2
= Ms1*(1+I2*K2)
+ I2*(My2*Vy2)*
Msn
= Ms(n-1)*(1+InKn)+In*Myn*Vyn)*Kn
(3)
Where Msn is the pool of deposits representing the debt
Dsn that has been created to fund deposit interest.
I1 ….. In is the average deposit interest through each
of the years 1 …. n
My1 … Myn is the average transaction deposits through
each of the years 1 ….. n
Vy1 … Vyn
is the number of production cycles during each of the years 1 …….n
K1……..Kn
is the proportion of deposit interest remaining after deduction of tax T1….Tn
during each of the years 1 ……..n
Equations
(1) to (3) are derived directly from Figure 2. They create an exponential
series, and the only difference between Figure 1 and Figure 2 is the
introduction of deposit interest. The thesis that deposit interest is the cause
of unsustainable debt growth is proven. Since the investment sector deposits Ms are largely funded
directly by the productive sector by price inflation and by realised capital
gains, if Ms is exponential, both the accumulated price inflation
and the transaction deposits My in the productive sector must
also be exponential.
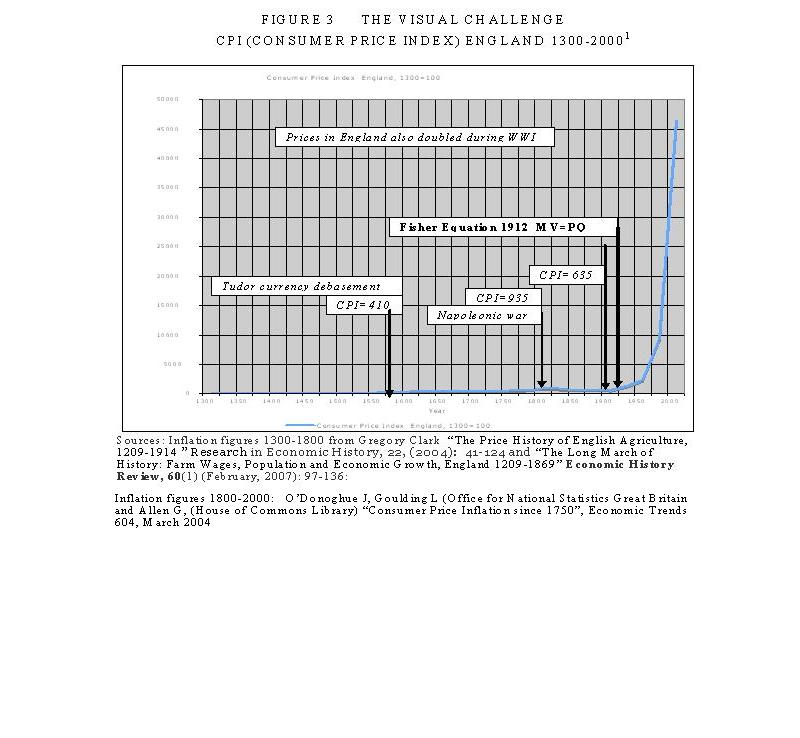
Figure
3 shows the dramatic impact of inflation in
Click
here to view FIGURE 3 :THE VISUAL
CHALLENGE CPI (CONSUMER PRICE INDEX)
ENGLAND 1300-2000. 42
40 Equations (1)-(3) include the
effect of net debt Ds
directly
borrowed for investment, which is introduced in section 6 of this paper, but do
not include any accumulated current account deficit or bubble debt that also
introduce further system deposits and net deposit interest.
41 Such as the removal of the US$
gold peg in 1971, “globalisation” and its accompanying freeing up of capital
flows, the introduction of Basel I risk-based capital requirements and the
repeal of the Glass-Steagall Act in the United States.
42 Sources:
Inflation figures 1300-1800 from Gregory Clark
“The Price
History of English Agriculture, 1209-1914 ” Research in Economic
History, 22, (2004): 41-124 and “The Long March of History: Farm
Wages, Population and Economic Growth, England 1209-1869” Economic
History Review, 60(1) (February, 2007): 97-136.
Inflation figures 1800-2000:
O’Donoghue J, Goulding L (Office for National Statistics Great Britain
and Allen G, (House of Commons Library) “Consumer Price Inflation since
43 By comparison, in
New Zealand in 1893 (a crisis year – RBNZ (2009b)) production was estimated to
be about
In
Figure 2 shows how exponential growth in prices is a
structural part of the debt-based financial system. Figure 3 suggests this has been a twentieth
century phenomenon.
The price index increased from
Figures 1, 2 and 3 suggest inflation is predominantly
caused by the interest rate on deposits. In that case, an obvious way to
achieve a stable economy is to remove interest on deposits to return the
financial system closer to what is shown in Figure 1 45. Low inflation cannot be maintained in an
economy when it must increase as a function of the deposit interest I and often
faster 46.
44 In New Zealand the Consumer Price Index
(CPI) increased by 583% between March 1978 and March 2010, while during the
same period domestic credit increased by roughly 3000%. [source RBNZ table
hc3].
45 Together with stabilising the current account and
progressively retiring foreign debt.
46 Annual inflation in Figure 2 is a function of My*I*Vy, but My can be
increased by any injection of debt, such as mortgage or consumer debt, from
outside the production system which increases My instead of
I.
Reducing or removing interest on deposits would have no
impact on bank lending decisions, nor, with appropriate policy instruments in
place would it lead to excessive demand for new debt. Lending decisions relate
primarily to the creditworthiness of borrowers.
Bad lending decisions, like those in the
On-going
efforts by central banks to control Consumer Price Index (CPI) inflation have
done little to halt inevitable rises in prices within the existing
interest-bearing debt-based financial system. They have superficially succeeded
up to a point only at incalculable cost to human lives, wellbeing and
development over the past century or more while at the same time transferring
nearly all the increased wealth to the minority of people and institutions
holding large deposits in the banking system. While the quality of life of some
of the world’s people has improved during that time the improvements are patchy
and fewer than they might otherwise have been. Exponential debt growth appears
to have reached the point where the productive economy can no longer satisfy
the profit expectations of the investment sector despite excessive and
unsustainable exploitation of the world’s labour force and natural resources.
The
unearned investment sector deposits Ms shown in Figure 2 give rise
to the cumulative unearned interest income on the deposits in the banking
system. Consumer prices are also locked into exponential expansion though
normally at a lower rate than Ms itself.
Consumer
prices inflate with the deposit interest rate I*K to pay the deposit interest
on the existing My into the unearned income pool Ms. Ms also increases by the amount
of new deposits that have to be added at
each production cycle to pay the deposit interest on Ms itself as well
deposits arising from bubble debt Db and the accumulated current
account deficit. 47
Figure
2 provides for numeric inflation equal to I*K*My*Vy to fund the interest on the
productive sector. If Ms is not less than or equal to My*Vy the interest difference would have to be drawn
from My itself which means producers are paying some
of the costs directly from their real incomes. Those holding debt backing
deposits arising for example, through the use of credit cards and new mortgages
that are used to buy non-productive capital and consumption goods that have
already been produced also have to find some way to fund the interest on them.
That debt can only come from realised capital gains on the sale of existing
assets or from “bubble” debt Db. Bubble debt injections allow wage and income earners to consume beyond
their financial means 48 but they are offset by “savings” in non-productive speculative
investment. Some leakage of Ms deposits back into My or leakage of My deposits out of My (as earned savings, for example) is also
possible. Any such net flows will destabilise the production cycle as
previously discussed.
Since
nearly all price is inflation the value of assets and goods and services would
become far more stable and predictable if interest on deposits, and hence
inflation were to be reduced or phased out.
Interest destroys value. The present system not only guarantees
unsustainable exponential debt growth, it also guarantees an exponentially
increasing transfer of wealth from borrowers to bank deposit holders. This
worsens the already critical problem of inequitable income distribution typical
of much of the developed world, especially
47 Db is described at section 6 of this paper.
48 The “keeping up with the Jones’s” syndrome
is encouraged through advertising and social pressure. The concepts of systemic
inflation developed here are very close to the “one-for-one” link between
interest and inflation predicted by Irving Fisher in his famous “ The Theory of
Interest”, New York, Macmillan, 1930 that has never before been proven.
05. The unsustainable economy with
foreign debt.
Recent
decades have seen vast changes in trade and capital flows giving rise to “free
trade”, globalisation and financial deregulation. The collapse of the sub-prime
mortgage market in the
Large-scale
foreign debt is a relatively new phenomenon in modern economies 49.
Until 1971 most of the developed world’s economies operated most of the time on
a gold standard using fixed exchange rates (albeit for a time indirectly
through what was known as the US$ gold peg)
US
President Nixon was forced to abandon the
49 Though national bankruptcies were far from
unknown in earlier times. For example the French Court of King Phillip IV was
bankrupted in the early 14h century having borrowed heavily for a
failed crusade to the holy land. Other
instances were King Phillip II of
50 In times of crisis some countries were
forced off the gold standard. This occurred during WWI when
51 The
Bretton Woods conference was where the WWII allies agreed on the
framework for the post WWII financial architecture, including he World Bank and
the International Monetary Fund.
Progressive
deregulation of capital flows, the growth of unearned income from interest on
deposits (Ms) and the
introduction of ever more complicated derivative trading instruments have long
since destroyed the principle of automatic exchange rate adjustments based on
real cash flows. Many debtor countries
including
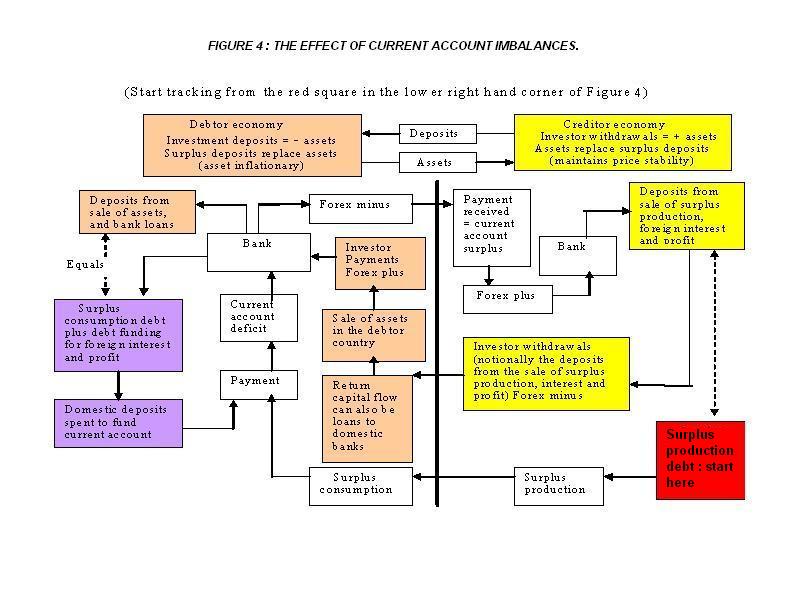
Figure
4 is the same as Figure 2 except that it makes provision for current account
deficits. It clearly demonstrates how
“carrying” the current account deficit through the productive economy as set
out in the System of National Accounts increases inflation throughout the productive
economy as well as increasing the pool of unearned deposit income that makes up
the investment sector.
Click here to view FIGURE 4: THE EFFECT OF CURRENT ACCOUNT IMBALANCES.
The
balance on external goods and services is shown in Table 1.1 of the SNA as a
(foreign) debt arising outside the production cycle shown in Figure 2 52. The trade deficit for any period forms part of
the nation’s accumulated current account. Theoretically, with a floating
exchange rate and open capital markets there should not be any surpluses or
deficits in the current account. Persistent current account deficits should
produce a lower exchange rate, automatically correcting the inwards and
outwards flows of goods and services. In practice a single monetary policy
instrument such as the Official Cash Rate (OCR), as it is used in countries
like
Current
account deficits result from aggregate withdrawals from the accounts of importers
and parties repatriating profits or otherwise transferring funds offshore.
Transfer of funds abroad should result in a corresponding sum of bank deposits
in offshore beneficiary accounts 54. Those offshore deposits are used to buy investments that are recorded
in the debtor country’s financial (capital) account
52 The trade deficit is subtracted from the consumption
side in SNA Table 1 so the trade account results in “saving” when it is in
surplus and “dis-saving” when it is in deficit. The deficit is, for those
countries whose currency is not a reserve currency, necessarily met by
borrowing on the current account accompanied by compensating inward capital
flows.
53 There is now a considerable body of research on this
but the statement is obvious from high school mathematics. You can solve for y
with one variable x in y=(f)x , but not in y= (f)x+(f)z .
54 Any good primary economics textbook should set out the
process.
55 For the
56 NIIP NZ$ 176.6b–derivatives NZ$ 2.0b–managed funds NZ$
3.7b–overseas shares held by NZ residents NZ$ 10.6b.
Within
the SNA international accounting system, a current account surplus is
shown as “Saving”
In the
SNA National income and outlay account the current account balance is shown as
part of the nation’s cash flow but it is, apparently, except for goods and
services, kept outside of the
production system. In practice, current account shortfalls seem to result from
deficit balances relating to productive activities and the foreign borrowing is
needed to meet profit and interest payments on the offshore debt and deficits
from current transactions 61. To allow for this, transaction deposits My shown for
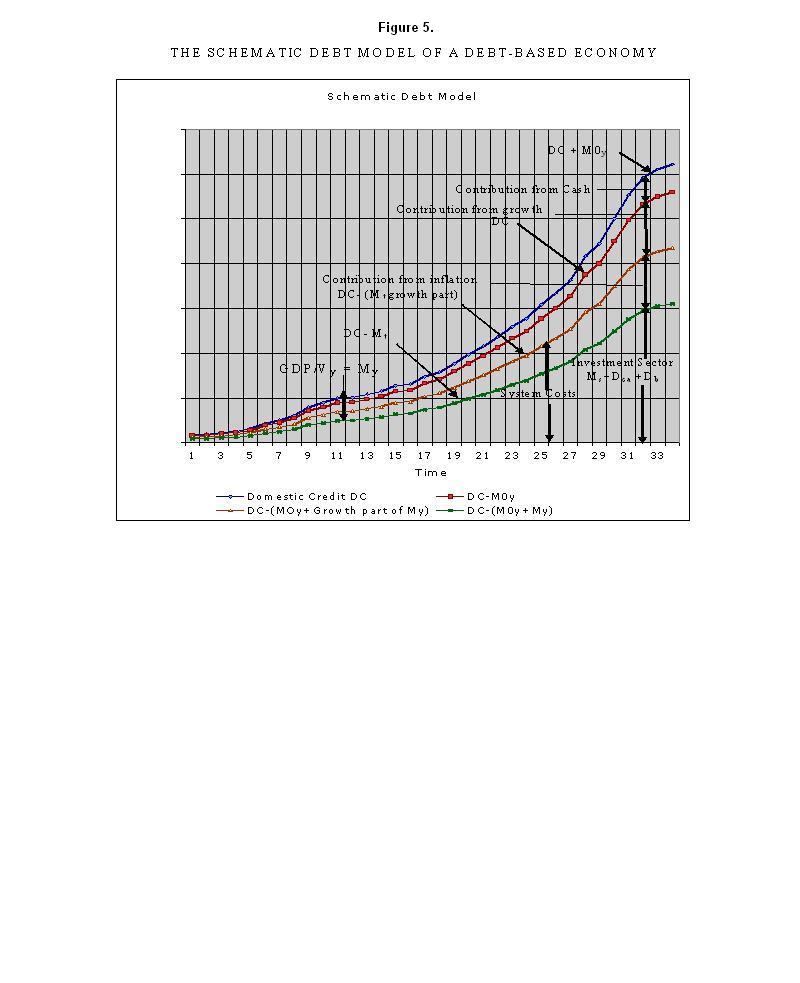
Click here to view FIGURE 5: THE SCHEMATIC DEBT-MODEL OF A DEBT-BASED
ECONOMY.
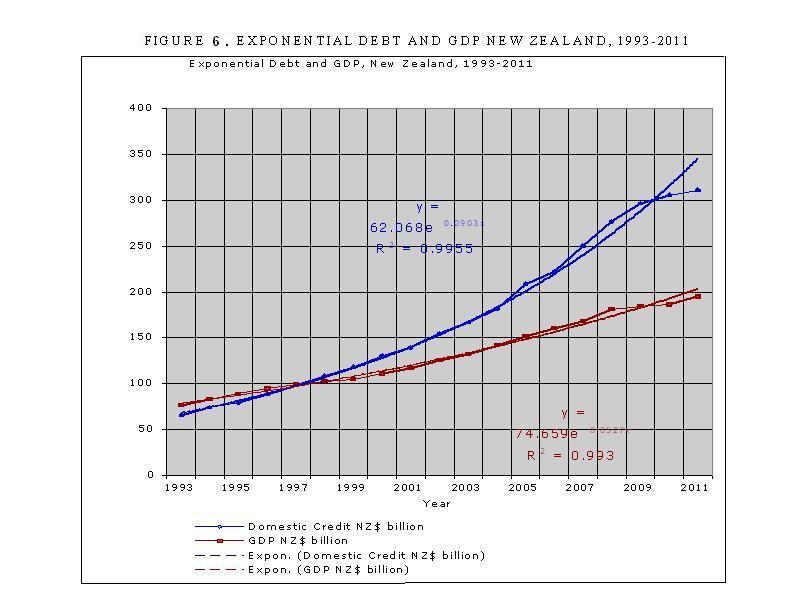
Click here to view FIGURE 6: EXPONENTIAL DEBT AND GDP IN NEW ZEALAND
1993-2011.
57 The SNA National income and
outlay account shows a current account surplus, “investment income from the
rest of the world, net” on the income side and the residual “Saving” on the
“use of income” side.
58 As shown in the National Accounts; National income and
outlay account, Table 1.2 .
59 Shown on the right hand side of Figure 1 as “exports
less imports”.
60 The SNA National income and outlay account is suspect
not just over the issue of saving but also because it incorporates an imaginary
number “consumption of fixed capital” to allow for depreciation that has
nothing to do directly with cash flows in the productive economy. “Consumption
of fixed capital” belongs only to assessments of net capital stock. The
appropriate figure to use for income/outlay purposes is “principal repayments
on capital goods”.
61 Statistics NZ Balance of Payments and International Investment
Position, March 2009, Table 10.
62 In line with the common saying that countries with
current account surpluses export inflation while those with current account
deficits import inflation.
63 Though in practice there is an on-going transfer through
the cycle rather than a lump sum at the end.
06. THE DEBT
MODEL.
The first version
of the debt model was published in the paper:
Manning, L “The Ripple Starts Here: 1694-2009 : Finishing the
Past”, presented at the 50th
Conference of the New Zealand Association of Economists (NZAE),
While the debt
model is based on the volume of debt, it is unrelated to earlier volume-based
reform proposals like those of Social Credit that failed to offer a viable
theoretical basis to support them.
The premise in both
the debt model and Figure 2 is that the circulating deposits and cash My = Prices P x output q where q
is the quantum of domestic output produced by My over a single cycle. Taken over a whole year, the SNA definition of
Gross Domestic Product GDP is given in the debt model by mathematically
integrating the expression Pq* Vy, where Vy is the number of times the
circulating deposits and cash My are used during the year 65.
The SNA should reflect
an expression of the original Fisher Equation of Exchange as shown in Figure 1 66. The only difference is that the money supply
M in the Fisher equation of exchange included hoarded cash, whereas in the debt
system shown in Figure 2 for practical purposes there is now very little cash
contributing to measured GDP.
In Figure 2 My cannot include hoarding of
debt beyond the term of the production cycle because all the productive bank
debt giving rise to My is conceptually repaid at the end of the cycle 67.
64. http://www.nzae.org.nz/conferences/2009/pdfs/The_Ripple_starts_here_1694-2009__Finishing_the_Past.pdf
. Non-members can access the paper by Google search: NZAE The Ripple Starts
Here (use “quick view”).
65. The contribution of cash transactions in industrialised countries is
now (very) small.
66. The Fisher equation has been very widely discussed in relation to the
economic difficulties arising from the sub-prime mortgage defaults in the
67. As previously noted, in practice there is a continuous flow of
production and consumption so the deposits and cash My are always present, but they are being used in the production cycle,
not hoarded.
At any point in
time there are five broad blocks of deposits in the domestic financial
system.
They are:
Mt The transaction
deposits representing the productive debt My - M0y so:
My
= Mt + M0y (4)
Mca The accumulated
domestic deposits representing the sale of assets to pay for the accumulated
current account deficit (see section 5 of this paper for details).
M0y The cash in circulation
included in My and used to contribute
to productive output.
Ms The net after tax accumulated deposits arising from
unearned deposit income on the total domestic banking system deposits M3 (excluding
repos) 68.
(M0-M0y) Cash hoarded by the public and not used
to generate measured GDP.
In this paper the
total of these deposits, that is, Mt + Mca + M0y + Ms , is provisionally assumed to
be the M3 (excluding repos) monetary aggregate published by most central banks monthly
less the amount of cash in circulation M0 except for the part M0y that is included in My. In this paper M0y is assumed to have the same
speed of circulation as My. In industrialised countries, the contribution of cash transactions to
the measured output of goods and services (GDP) has been declining in recent
decades and their contribution to the GDP has been provisionally calibrated for
the purposes of this paper 69.
In this paper, the
total debt in the domestic financial system is assumed to be the Domestic
Credit, DC debt aggregate published by most central banks monthly.
At any point in
time there are four broad blocks of domestic debt in the domestic
financial system. Three of them together add up to DC such that:
DC = Dt + Dca 70 + Ds (5)
Where :
Dt is the productive debt supporting the
transaction
Dca is the whole
of the debt created in the domestic banking system to satisfy the accumulated
current account deficit 71.
Ds is the residual debt to balance equation (5)
68. Repos refer to inter-institutional lending
69. More accurate assessment of
the cash contribution to GDP over time requires further detailed study.
70. Arguably the accumulated sum of capital transfers could be included here,
in which case the net international investment position (NIIP) would be used
instead of the accumulated current account. The decision affects the size of
the “residual” Db.
71. This is greater than the
monetary deposits Mca because the
banking system may have sold commercial paper to borrow foreign currency to
satisfy the foreign exchange settlement as shown in Figure 4.
The fourth block of debt is :
Db, the virtual “bubble” debt, the
excess credit expansion or contraction in the banking system such that Ds - Db = the debt supporting the accumulated deposit interest Ms defined above. Db can be positive or negative
as discussed further below in relation to Figure 9.
There is also a
fifth block of debt Is that is, conceptually, not bank debt .
Is is
the total debt accumulated by investors to buy capital goods arising from
Saving Sy = S/Vy.
where S is national saving measured as gross capital formation less repayments
of principal made on all existing capital goods.
Conceptually
the investor borrows the purchase price of the capital goods from employee
incomes and the business operating surplus. The investor pays the investment Iy
=I/Vy = Sy = S/Vy to the producer and the money is used
to retire the outstanding part of My relating
to the investment in question. The principal repayments on productive capital
investment, being part of Iy (=Sy)
is included together with the interest on the investment principal as a
production cost in the subsequent production cycle loans My,
allowing the investor’s debt to producers to be repaid over time.
The predicament of
new homeowners is quite different. They cannot service their debt because they
cannot, conceptually earn more than they were before they bought their new
home, because the home itself is nearly always unproductive. There is no new
income stream from their housing investment. If economic demand is to be
maintained, homeowners must, in aggregate, rely upon increasing house prices and
refinancing of their properties, creating an aggregate “pass the baton”
systemic increase in debt.
When non-productive investment assets
are traded there is typically a capital gain because of asset inflation on
investment (Dca + Ms + the property component of Is). The new purchaser pays more for the asset
because of asset inflation, allowing the seller to retire the outstanding
mortgage debt on the property.
By definition in this paper :
My *Vy =
GDP
Ms = Ds
The cash contribution to GDP =
M0y * Vy. Therefore :
DC = (GDP)/Vy - M0y + Ms + Dca
+ Db (6)
Ms =Ds =
(DC – Dca ) – GDP/Vy + M0y - Db (7)
GDP = Vy *(DC - (Ms +Dca
+Db ) + M0y ) (8)
My = GDP/Vy
= DC - (Ms +Dca + Db) + M0y (9)
Where the terms are as already
defined above.
Equations (6 ) to
(9) are all forms of the debt model developed in an earlier paper 72.
72.
Links are provided in the conclusion to this paper.
Ms is the same format as Ms in the earlier forms of the
model. It has been freshly calibrated. Unlike the previous forms of the model
equations (6) to (9) are general and include the contribution made to the
economy by cash transactions.
In equation (7),
all the terms except GDP/Vy = My and Db are known or can be estimated
with reasonable accuracy. For the purposes of equations (8) and (9) My can be approximated using
trend-lines because it is small compared with Ms. Db is unknown but can be
approximated through the calibration as in Figure 9. The calculations in
equations (8) and (9) involve the subtraction of large numbers to get
relatively small numbers, which leaves them sensitive to modelling and data
error.
If Ms , calculated as “the
accumulated deposits arising from unearned deposit income on the total domestic
banking system deposits M3(excluding repos) ” as defined above,
agrees more or less with that calculated in equation (7), bearing in mind the
value of Mb , the proposition
that debt growth is determined by deposit interest will be proven. The model will require further calibration as
further data becomes available. Despite
that, it is self-evident Db will be positive during periods of rapid expansion, particularly as
bubbles form, and will become negative during periods of rapid contraction,
particularly as bubbles collapse. The classic case of this in
The dependence of the
gross domestic product (GDP) on the Domestic Credit DC and the interest rate on
bank deposits in the modern cash-free economy from which Ms is calculated has profound
implications for economics.
In the light of the
worldwide financial chaos of 2007-2009 the indicative debt model shown in
Figure 5 provides a powerful argument in support of public control of a
nation’s financial system.
Click here to view FIGURE 5 : THE SCHEMATIC DEBT MODEL OF A DEBT-BASED ECONOMY.
The vertical axis
in Figure 5 applies to the Domestic Credit for
It isn’t possible
to have a simpler model of the economy than equation (8):
My =Nominal GDP/Vy = domestic credit DC less (unearned net deposit
income Ms + the accumulated current account Dca + the cash
contribution to GDP M0y plus a
correction for bubble activity Db (+/-)).
Domestic
Click here to view FIGURE 6 : EXPONENTIAL DEBT AND
GDP NEW ZEALAND, 1993-2011.
It is theoretically impossible
to maintain exponential debt expansion faster than GDP expansion over an
extended period because the added debt servicing costs will always leave the
productive sector insolvent.
To avoid national
bankruptcy, each nation must maintain, in aggregate, a zero accumulated current
account deficit.
A first
approximation for the speed of circulation Vy of productive debt plus cash transactions My is given in Figure 7. Vy varies with the change in the
payments systems. Minor secondary shorter-term cyclical variability also occurs
through changes in the average time taken to pay bills. When times are tough people take longer to
pay their bills, and each change of a day in the time taken to pay them can
alter Vy by perhaps 0.25%.
The process is usually reversed in better times. Otherwise Vy reached a constant value of
about
73. Vy is estimated at the moment
so the present figures are indicative. Once further research accurately refines
the present estimates, Vy will be
sufficiently accurate for predictive purposes.
Click here to view FIGURE 7 : SPEED OF CIRCULATION Vy NEW ZEALAND 1978-2011.
Note that in Figure
7, no correction has been applied to Vy for secondary increases in
payment time during recessions or decreases in payment time during economic
boom periods. The maximum correction in Vy appears to be in the
order of +/- 0.3 or up to 1.5%. The series shown is less stable from 1978 to
1989. This is possibly due to distinctly different growth exponentials
1978-1989 arising from the very high interest rates that were typical during
those years.
As shown in Figure 8, My in
Click here to view FIGURE 8 : ESTIMATED TRANSACTION FUNDING My NEW ZEALAND
1990-2011.
The methodology
used to calculate Vy in Figure 8 is as follows. The GDP in
Businesses pay
suppliers monthly, and indirect payments are usually made on a monthly basis
too, so their speed of circulation is about 12 on average. Most workers get
paid fortnightly (though some get paid weekly and some monthly) so an average
speed of circulation of 26 has been assumed for that.
When the above figures are
weighted the weighted average speed of circulation is (12 * (42.7+12.3)+45 *
26)/100 = 18.3.
A similar estimate
of payment trends and a separate Vy calculation was made for each
of the other years, and a polynomial best fit curve was drawn as in Figure
8.
My was then obtained by dividing
the official GDP figure by the speed of circulation taken off the best fit
trend curve. This gives the data series
shown in Figure 9 and used when applying
the debt model.
The methodology is
easily replicable using better information about payment trends and is
applicable to any country.
Figure 8 shows the
preliminary estimate for estimated production debt and cash My in
Figure 9 shows an
indicative comparison between the residual debt Ds for New Zealand calculated
from equation (5) and plotted against the model Ms calculated as the accumulated
after tax deposit interest on M3 (excluding repos). The curve for Ms is a first approximation
because assumptions have been made on the average tax deducted from the gross
payments of unearned income (M3 (excluding repos x the average interest paid on
deposits). The tax is the average tax paid by each income-earner on his or her
total income. It is not the marginal tax rate 74. The losses from the 1987 share market crash
in
Once the tax rates
on Ms have been
accurately calibrated, the size of any debt bubble Db can be immediately
calculated. Measures can then be taken to eliminate the bubble without risking
any economic downturn.
Click here to view FIGURE 9 : BUBBLE DEBT Db AND Ms NEW ZEALAND
1978-2011.
One of these, of
interest to New Zealand’s recent economic performance, relates to the impact of
banks increasing their reserves by increasing the bank spread, which is the
difference between the lending (or claims) rate they charge their clients and
the interest they pay on their customers’ deposits (their funding rate).
Were the banks to set aside some of their income for reserves instead of
feeding it into the income stream in wages and profits the effect would be
similar to the case for aggregate earned savings 75. In both cases, deposits arising from debt My supporting
the transaction deposits in the productive economy are withdrawn
from the production cycle. While earned savings, could they in the aggregate
occur, would be transferred from the productive sector to the investment
sector, bank reserves are withdrawn from circulation altogether and do not form
part of the productive money supply. Less income would then remain available to
consume the productive output. In the short term, in Figures (1,2,4), the
market would not be able to clear and either prices P would tend to fall or
output q would tend to fall as inventories rise, creating deflation and
unemployment. More typically P and q would both fall. The only other possibility is that consumers seek to replace the
shortfall by borrowing more from the bank to maintain their levels of
consumption.
Widespread borrowing for consumption purposes does not alter the
principle that in the basic economic cycle described in Figures (1,2,4) “Earned
Saving” is used to fund and repay principal on existing capital goods . Any
other “savings” must be borrowed. 76 77
Banks seek to increase their reserves when they foresee future losses
from bad debt arising during economic downturns. They then need higher reserves
because losses are drawn from the banks’ net worth that includes their reserves
78. The increases in reserves can be funded from
retained profit or by increasing the bank spread. The banks could also generate
new capital through the issue of shares, bonds, or debentures. Recent figures
for
75. Earned savings, could they
occur in aggregate, would be the portion of total productive (earned) income hoarded by consumers for later
use, for example as a deposit on a future home purchase, superannuation funds
(including funded government superannuation schemes), and worker/employer
savings schemes like Kiwisaver in New Zealand.
76. The mechanics
of unearned “saving” are outside the scope of this paper.
77. For example, “Economics
Principles and Policy” William J Baumol and Alan S Blinder, 4th
Edition Harcourt Brace Jovanovich, 1988.
78 . .Paying
losses from deposits is illegal and traditionally happens only when banks fail.
That is why some western countries, including
TABLE 1: RECENT CHANGES IN BANK SPREAD IN
|
YEAR |
2005 |
2006 |
2007 |
2008 |
2009 |
2009 |
2009 |
2009 |
2010 |
|
|
MAR |
MAR |
MAR |
MAR |
MAR |
JUN |
SEP |
DEC |
MAR |
|
% spread |
2.37 |
2.10 |
2.04 |
1.67 |
2.85 |
2.99 |
2.85 |
2.76 |
2.55 |
|
claims |
7.51 |
8.14 |
8.36 |
9.01 |
6.96 |
6.52 |
6.39 |
6.22 |
6.16 |
|
deposit |
5.14 |
6.04 |
6.24 |
7.34 |
4.11 |
3.53 |
3.54 |
3.54 |
3.60 |
(Source RBNZ Table hc10)
Mainly to increase their reserves, the banks operating in
79. Bank reserves do not form part of
the “money” supply. Arguably March 2008 represented a low point in the banks’
historical spread, but the economic impact of the withdrawal of bank reserves
from earned incomes was nevertheless very real.
07. SYSTEMIC
INFLATION AND INFLATION POLICY.
Click here to view FIGURE 2 :THE UNSTABLE PRODUCTION CYCLE.
Figure 2 shows what
happens when funding interest If % is paid on bank deposits. The dynamic production debt My is all repaid in full to the
bank at the end of each cycle. The funding interest If % paid by a bank is a bank liability, not an asset.
The deposits belong to deposit holders. The bank must transfer to them the
deposit interest it receives when the production debt My is repaid. At first sight the bank would be losing
money because it would be left in debt by the same amount as the deposit
interest.
In practice, the production
system does not “pulse” as shown for simplicity in Figure 2. Instead, there is an ongoing dynamic flow of
production and consumption funded by the dynamic production debt My. The pool of residual debt (My in this paper) shown at the
lower centre of Figure 2 is the accumulated interest component My*If % /(Vy*100) created through
each nominal business cycle. 80 Since the price P itself is the
sum of the price increases shown at the bottom right of Figure 2, price P must
represent the total price inflation.
Assuming production
Q is constant, the deposit interest If % (less tax) can be paid to depositors only if prices
P increase as shown. Otherwise the
production debt My cannot be cleared
when the economic production Pq 81 is sold. In this paper, the inflation caused by the deposit interest on
the dynamic production debt My is called systemic inflation.
In an economy based on
interest bearing debt, almost all price is inflation.
80. My is a dynamic variable similar
to those used in almost iterative computer programme. The new total becomes the
old total for that variable plus the increment added to it each cycle.
81. The quantity of production q is what is produced in the single
nominal production cycle shown in Figure 4. The amount q must be multiplied by
the speed of circulation Vy to get total
output Q.
Click
here to view FIGURE 3 :THE VISUAL
CHALLENGE CPI (CONSUMER PRICE INDEX)
ENGLAND 1300-2000.
Figure 3 gives a historical
overview of inflation in
By the beginning of
the 20th century prices had increased by just 6 times in 600 years,
with nearly all the increases due to the “great debasement” of the mid-Tudor
period and the Napoleonic wars around the turn of the 19th century.
Prices fell by about one third between 1800 and 1900 during the industrial
revolution due to vast improvements in productivity. Higher productivity means more goods and
services are produced for the same input costs leading to lower prices P if
money M and speed of circulation V remain constant.
![]()
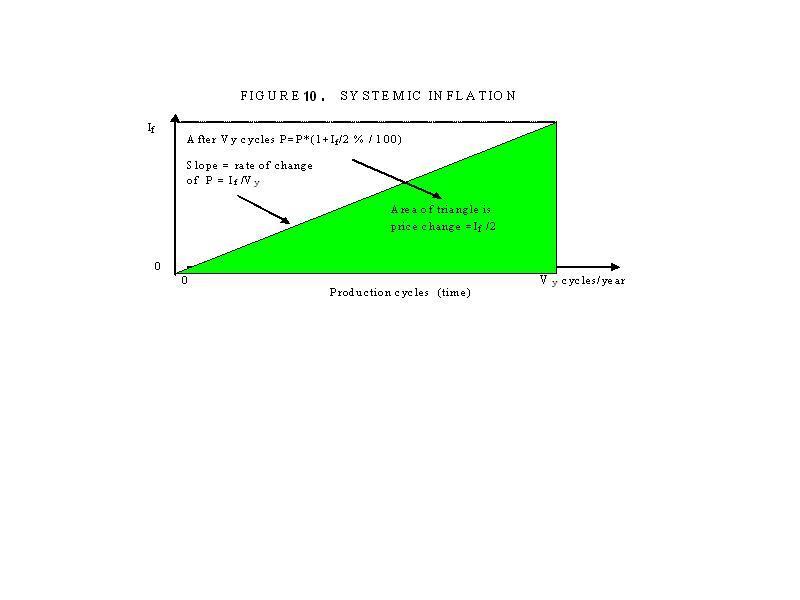
![]() The price change
formula P=P*(1+ If % /(Vy *100)) shown at the bottom right of Figure 2 refers to a single production
cycle producing the (constant) economic output q. Figure 10 shows that,
assuming the deposit interest rate If and output Q are
more or less constant, physical inflation is half of If %. The figure P* If % /(Vy *100) is the rate of change of P. It must be
mathematically integrated to give the total numerical change in P. This
increase in price in called systemic inflation.
The price change
formula P=P*(1+ If % /(Vy *100)) shown at the bottom right of Figure 2 refers to a single production
cycle producing the (constant) economic output q. Figure 10 shows that,
assuming the deposit interest rate If and output Q are
more or less constant, physical inflation is half of If %. The figure P* If % /(Vy *100) is the rate of change of P. It must be
mathematically integrated to give the total numerical change in P. This
increase in price in called systemic inflation.
Click here to view FIGURE 10 : SYSTEMIC INFLATION.
Systemic inflation is
a structural part of the debt-based financial system whenever interest is paid
on deposits.
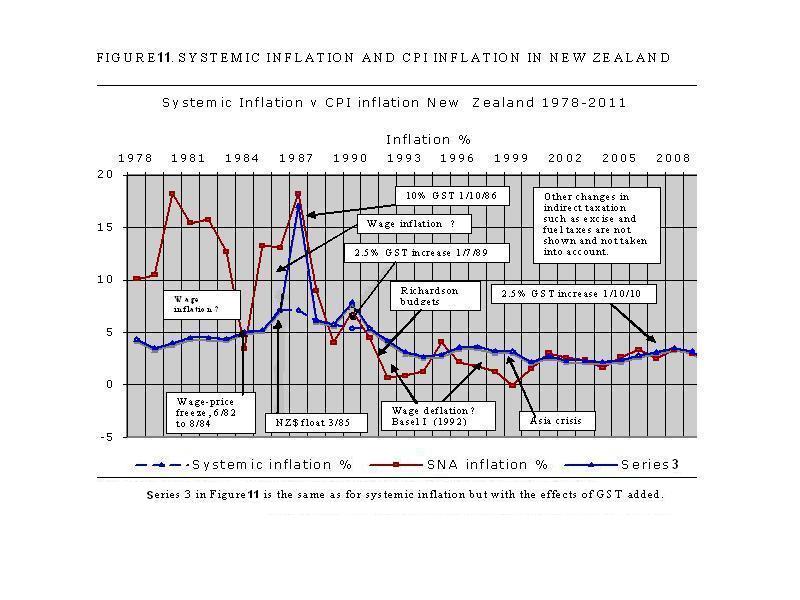
Figure 11 compares
systemic inflation with consumer price inflation (CPI) in
Click here to view FIGURE 11. SYSTEMIC INFLATION
AND CPI INFLATION IN NEW ZEALAND.
Rapid wage
increases increase the debt for production My faster than would normally be
the case. From the original Fisher Equation (1) MV=PQ, if M rises while V and Q
stay the same, P must rise in proportion to the rise in M. This is what happened before the debt-based
financial system became dominant after WWII as shown in Figure 3. It also seems
to have happened in
82. This raises an interesting debate about comparing averages with indices
and the relationship between price indices and measured economic growth. The
saw-tooth form of the official SNA data in Figure 7 suggests serious issues
with economic management from 1978-1999.
83. The 1983 and 1985 years will still have been affected by wage factors
even though they fell partly within the period of the wage-price freeze.
When economic
productivity increases, more goods and services are produced using the same
productive debt My because, in
aggregate, the unit cost of each item produced is a little less than it was
previously. In the original Fisher
equation (MV=PQ), if M
and V remain constant and Q increases then P must decrease.
The price of many
items has fallen dramatically over the years as shown, for example, in Figure 3
during the industrial revolution in
Productivity growth
is inherently deflationary.
Labour productivity
is often measured by dividing the value of total production, the gross domestic
product (PQ), by the total number of paid hours worked. Capital productivity is often measured by
dividing PQ by the total current productive investment.. Education and skill
levels play a major in both measures because they allow new ideas and new
technologies to be introduced. Caution
needs to be used when applying productivity figures because the methods used to
measure them can be inaccurate. Typically, employees with higher education and
skill levels are paid more. That tends
to increase some incomes at the expense of others, distorting the income
distribution in most western economies.
The most extreme form of this is the very high compensation packages now
being paid to the executives of large corporations.
This paper assumes
that, in aggregate, wages inflate at systemic inflation plus the rate of
productivity growth to maintain overall price levels. One key reason why so many employees in
modern industrial economies feel and are in fact worse off is because the
benefits of productivity increases are skewed as discussed above 84. The increasing skew can be
corrected only by income redistribution within the economy.
84. Discussion of the income skew is outside the scope of this paper, but
one common way to measure it is by using GINI coefficients. The higher the
coefficient the more skewed he income structure is. Over the past 30 years
In a debt-based economy
where interest is paid on deposits, systemic inflation is half the interest
rate If paid on deposits provided adjusted incomes rise in
line with inflation and productivity growth and there are no changes to
indirect taxes.
Distributing the benefits
of productivity increases throughout the economy by improving real wage levels
and purchasing power requires socially mandated income redistribution.
Many developed
countries have failed to redistribute the benefits of increased productivity,
with consequent loss of consumption capacity in the wider economy. The classic
case of this in recent years is the tax cuts made by recent republican
presidents in the
Deposit interest
rates declined in
85.
86. Other possible explanations are the backward “smoothing” of official
data after the introduction of the revised System of National Accounts (SNA 93)
in 1996 and the implementation of the
Click here to view FIGURE 11. SYSTEMIC INFLATION
AND CPI INFLATION IN NEW ZEALAND.
Eliminating
systemic inflation by removing deposit interest would resolve
87. People would still “save”, given the chance, even with zero deposit
interest, as long as there is little or no inflation. People saved for
thousands of years before the debt system was in use because, like some other
species, HUMANS ARE HOARDERS. Protecting themselves against hard times is
instinctive.
88.
In New
Zealand, the sharp reductions in interest rates from the end of 2008 reduced
the inflationary impact of systemic inflation at the same time banks began
increasing their margins and “shutting up shop” by making lending more
difficult. The banks’ actions drew money out of the economy at the same time
the government was trying to stimulate it.
Better policy coordination would have reduced the depth and length of
the recent recession.
Aggregate
increases in inventory are also a sensitive indicator of declining purchasing
power in the economy. They mean consumers lack the disposable income needed to
consume all the current production. That lack of income can arise in part from
efforts to hoard “earned” savings 89. It can also be caused by reductions in
employees’ incomes that result from increases in interest rates applied under
orthodox monetary policy settings to manage inflation. Consumers’ disposable
incomes will fall unless the interest rate increases are fully compensated in
employee incomes 90. There is a
reduction in consumption with accompanying unemployment until either inventory
is returned to normal levels or consumption demand expands.
89 That will be made a lot worse by current suggestions
in New Zealand to implement compulsory superannuation contributions that will
result in lower living standards unless ALL the money collected is channelled
into productive investment, that is, into the circulating debt My and
subsequently on-loaned to entrepreneurs.
90 As already described, disposable incomes are reduced
by the extra interest claimed by the investment sector as a result of the
higher interest rates.
While a
full discussion of savings lies outside the scope of this paper, government
efforts in New Zealand to increase savings for investment purposes, as, for
example in the 2010/2011 budget speech of 20th May 2010 are
problematic. Trying to draw savings from the productive debt My in a wholly debt based
financial system prevents the
productive economy from expanding properly because it reduces both consumption
capacity and the gross operating surplus in the economy as a whole. Such saving
would make sense only if it were re-directed immediately as part of My into new productive
investment, thereby offering significant productivity gains to the economy.
This paper shows such investment would then need to be accompanied by increased
incomes to enable that new production to be consumed. Exactly the opposite is happening. Savings
are being withdrawn from consumption and mostly invested in the investment
sector offshore. Conceptually they
form part of Db in the revised
Fisher equation. This gives
91 There might be some repatriation of dividends on the
investment but, in
This
paper reduces the savings debate to a single simple proposition:
In
aggregate it is possible to save debt-free money but it is not possible to save
debt unless that debt exists as speculative investment (Ms ,Dca ,Db) outside the
productive economy. If the “savings” are reinvested in the productive economy they
become part of My and have to be reflected in new productive incomes
while those who took on the extra debt still carry it until it is paid off.
There
does not appear to be any financial mechanism available in the current
financial system, as it is detailed in this paper, to bring about long term
inflation stability other than by very low
(or zero) deposit interest rates. Low deposit interest rates will, in
turn, probably require quite drastic action to prevent capital flight and bring
the current account into balance, such as by the application of an appropriate
surcharge on
There
are no existing monetary policy instruments available to adequately address the
systemic nature of inflation in the productive economy.
A
separate paper is needed to further “flesh out” the impact of taxation on
unearned income deposits. While the New Zealand banks supply a tax deduction
certificate for each account they hold, that aggregate information may need to
be collated from the banks themselves, and then some assessment made of how
that tax is adjusted within individual tax returns; a complex task beyond the
scope of this paper. That necessarily means Figures 9 and 11 are provisional
and indicative. The additional research is needed because the debt model
application is dependent on the numerical value of the accumulated deposit
interest Ms. The taxation of
deposit interest significantly affects the net Ms value 92.
92 Using the gross pre-tax value of Ms, as in
Manning (2009), distorts the numerical model application.
08. THE DEBT
EXPLOSION AND FINANCIAL STABILITY.
Figure
12 shows
Figure
12 shows that for all practical purposes, all of
Click here to view FIGURE 12: INCREASE
IN GDP v INCREASE IN ACCUMULATED CURRENT ACCOUNT NEW ZEALAND 1978-2010.
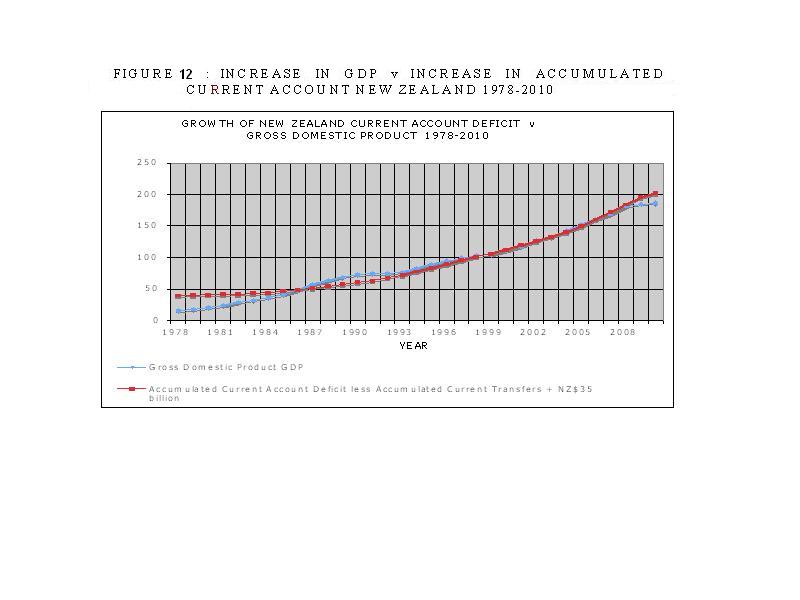
The process
described in this paper setting out the mechanics of the present debt-based
financial system does not seem to have been described anywhere before, but, as
Figure 6 clearly shows, debt expansion in New Zealand has actually taken place,
as it must, in accordance with the revised Fisher Equation of Exchange and the
debt model presented in 2009 94.
93 The NZ$ 35 billion is an arbitrary amount added for
visual effect.
94 Manning, 2009.
95 Issued by the Bank for International
Settlements (BIS) in
The mechanics of
fractional reserve banking are widely known and described in many good primary
economics textbooks 96. The process was
that central banks 97 purchase securities, mainly bonds,
usually from commercial banks. The banks “sell” a loan to the central bank that
then “pays” for the loan by writing deposits into their reserve accounts at the
central bank (RBNZ 2008b). Because the central banks, from an accounting point
of view, have borrowed from the commercial banks, the central banks pay
interest (called the coupon rate) to the commercial banks on the deposits the
central bank has itself created for them.
Central
banks gift the “high powered” deposits they put into the commercial banks’
reserve accounts and pay interest in perpetuity on those gifts 98.
96 See for example
Blaumol W.J & Blinder A.S.
“Economics Principles and
Policy”, Harcourt Brace Jovanovich, fourth edition Chapters 13 & 14 .
97 Central banks are bankers’
banks that are responsible for implementing government monetary policy and
maintaining the stability of the financial system. Some central banks like
those of
98 The central banks retain the
power to sell their bonds, that is require repayment from the banks, but that
is rarely done to any large extent because it would cause a big drop in bank
lending capacity. Treasury T-bills (bonds with less than 1 year term) and the
Official Cash Rate (OCR) are typically used to adjust lending capacity.
From
the public perspective it is very hard to conceive of a less fortunate way for
governments through their central banks, some of which are not even publicly
owned, to increase the base money supply. The “risk-weighted” capital method
now in use may be even worse than the
reserve method because there is no direct mechanism for central banks to
rapidly expand lending when there is a credit squeeze (such as, for example, from
2007-2010) other than by the injection of new central bank funding or
government treasury debt.
The
reserves created by the banking system from the banks’ sales of bonds to their
central banks were like cash. They are what the banking system used to
exponentially expand lending in the manner set out in the textbooks so that
banks could continue lending and pay interest on the deposits held in their
clients’ deposit accounts.
In the
investment sector every loan made by commercial banks to facilitate the
purchase of an existing capital good such as property, shares or securities
requires deposit interest to be paid. Each of those loans produces its own
corresponding residual Ms debt and exponentially increases the pool of un-repayable 99 unearned deposit interest.
Annually, the pool of deposit interest on the accrued residual debt Ms increases on
itself at the rate of the deposit interest rate I*K as shown in Figures 2 and
4. It is “pumped” into the deposit interest pool from the production cycle 100 along with My , Dca , and Db.
The
size of the non-productive investment sectors Ms and Db , especially when
“off-book” derivative transactions are included, relative to the amount of
circulating debt My together with the net worth the banks have
accumulated to cover any debt defaults, has increased the instability of the
present debt system.
Domestic
banks must expand their lending to support the deposit interest
burden on the domestically accrued debt. If the banks do not lend enough to do
so they would be unable to pay all the deposit interest due on their customers’
deposits unless My itself is reduced assuming Vy is structurally stable. The
effect is clearly shown in Figure 9.
The
present fractional reserve mechanism of debt expansion is haphazard because it
is not properly based on the true demand for debt from within the financial
system as shown in Figures 2 and 4 and in the debt model referred to in this
paper. Instead, present debt creation is dictated by monetary policy that
produces discontinuities in the available supply of new debt. Despite the best
efforts of the monetary authorities, those discontinuities inevitably lead to
mismatches in the production cycle and associated expansions and recessions
characterised by boom and bust cycles.
Lending
must continuously and smoothly satisfy the mechanical systemic demands of the
financial system rather than the whims of monetary policy. This paper provides
a basis for more accurate assessment of the amount of new debt needed for the
smooth running of the economy without the distortions created by orthodox
monetary policy.
Financial
system stability also depends upon unearned income deposits arising from
deposit interest remaining in the investment sector or paper economy as it is
often called 101. For this to
happen the expected financial return from keeping the deposits in the
investment sector must exceed the perceived benefit arising from any
corresponding investment in production or consumption. The numerical incentive for deposits to
remain locked into the investment sector is the extra annual amount (Ms+ Dca+ Db)*K*I added to the investment
sector deposits, because they inflate the investment sector by that amount
raising prices there relative to the productive economy. The incentive to invest can be expressed as a
percentage (Ms+Dca+Db)*K*I/(M3-repos)*100 less the
systemic inflation and changes in indirect taxes in the productive sector
expressed as a percentage of GDP.
99 The debt Ms supporting the accumulated deposit interest is unrepayable because the holders of the
deposits are not the same as those who hold the debt. Provided the bank does
not fail, Ms always remains in the
system whatever happens, even when debtors default on their loans.
100 Some degree of
quantification of price effects within the investment sector appears to be
theoretically possible using the debt model and deserves further research.
101 The only other
place it can go is into the productive economy, increasing incomes and gross
operating surplus thereby increasing measured inflation. There is little doubt
such transfers do occur both ways.
During
the periods some decades ago when GDP (My * Vy) expanded
faster than the accumulated deposit interest there was a much higher incentive
to invest in new production instead of speculation, so the GDP usually
increased as fast or faster than the prices of existing assets. For the past 20
years there has been an incentive to leave money in the investment sector
instead of using it to expand production.
As
Figure 8 shows, that is no longer the case in
A
likely outcome should deposit interest If or the incentive to invest
approach zero would be an increase in finance company lending and greater
investment in equities and other productive activity. The “incentive to invest”
as shown in Figure 13 is an entirely new economic concept.
Click here to view
: FIGURE 13 INCENTIVE FOR DEPOSITS ARISING FROM DEBT TO
REMAIN IN THE INVESTMENT SECTOR NEW ZEALAND
1988-2010. Figure 13 includes assumed
taxation rates on deposit interest of 50% from 1978-1993, 40% from 1994-1999,
30% from 2000-2005, 26% from 2006-2009, and 24% from 2010-2011.
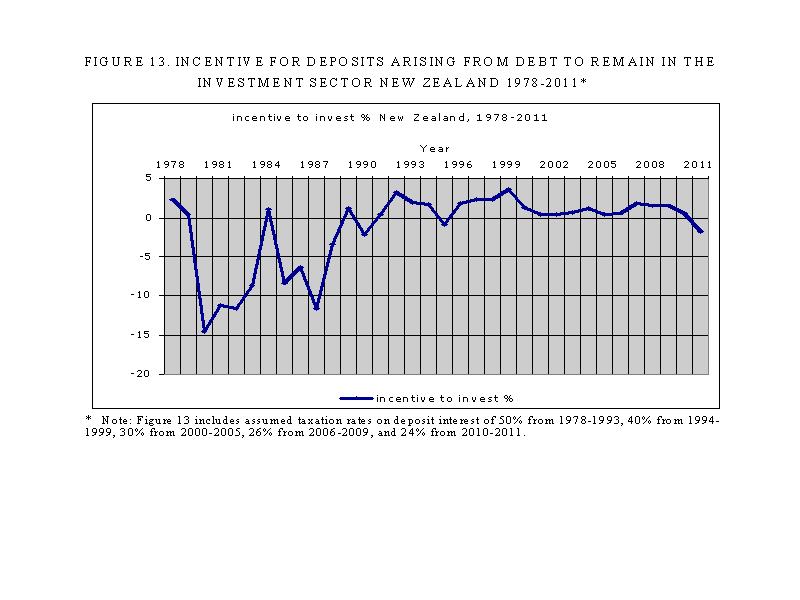
09. CULTURE AND
INSTITUTIONS.
The
financial debt mechanisms described in this paper could have been observed and
understood at any time since the Bank of England was established in 1694. They
could have become more obvious as debt growth and accompanying monetary
expansion accelerated over the past century.
One reason the mechanics of the debt system have not come to light until
now could be the asymmetrical exercise of power in the world economy through
dominance of its national and international financial institutions by vested
interests.
The
French economist Perroux (1966) first introduced the concept of dominant
revenue. He traced the evolution of
economic domination from the landowners (aristocracy) of the middle ages through
mercantilism (merchants) of the colonial period to industrial capitalism
(industrial corporations) from the industrial revolution until post world war
II, and more recently to finance (banking and financial institutions). Strange (1996) has reinforced the notion of
power as “the capacity to conceive, legitimise, implement and control rules for
individual and collective action” even when there is large-scale opposition to
those rules. Other writers like Palley, (2009) suggest what some of the
“problems inherent in the neo-liberal
Finance
as the “dominant revenue” 102 is maintained through an unbroken chain of authority reaching down from
the Bank for International Settlements (BIS) through international financial
organizations like the International Monetary Fund (IMF) and the World Bank, to
Central Banks like the US Federal Reserve and its member organisations, and
some universities like the University of Chicago who have continued to support
existing orthodox economic theory after it became apparent the present system
had become dysfunctional. In the United States especially, the lack of
effective constitutional restraints on campaign spending, advertising and lobbying
have effectively rendered democratic institutions like the US Congress and the
US Executive branch captive to the centres of power, especially that of
finance. The financial collapse that began in the
Some of
the debt “contagion” that has swept the world in recent years probably would
have been avoided had the world adopted the principle of balanced trading
accounts proposed by John Maynard Keynes representing the UK delegation at the
Bretton Woods conference in 1944 104. That
102 Exemplified in recent times by the huge bonus payments
made by the dominant
103 Northern Rock in
104 The conference at Bretton Woods New
Hampshire in 1944 established the basic outline of the international financial
system that was to be established after WWII.
The mechanisms
described in this paper are still forcing the vast
Inflationary
consumer borrowing in the US and elsewhere, using residential property as
security, allowed excess consumption to continue until the point was reached
where consumers could no longer fund their debt. This happened in part because
under the Basle accords that regulate bank investment risk residential property
carries a much lower risk weighting than business lending (RBNZ, 2009c). Those
factors combined with the growing concentration of wealth in
Weakening
finance as the dominant revenue is also inherent in the necessary changes in
the world’s financial structure implied in this paper. This could, in turn,
lead to the third great economic revolution the world has seen, being one based
on human and natural capital in its broadest sense. The third revolution, just
beginning, will recognise and accept the environmental constraints of human
activity and ethical limits to human population expansion, valuing the quality
of life rather than, or at least as well as, the quantity of material wealth 107.
An
exclusive right for a publicly-owned authority to issue new debt (and money)
would mean that private banks could no longer create new debt. New debt (and
e-money) spent into circulation would still finish up in deposits with the private
banking system. These earned deposits could then be used by deposit-holders
and/or on their authorisation by the banks on terms, including the rates of
interest, they see fit. The banks would be acting as savings and loan
institutions. Should deposit-holders not spend their money, they are in fact
limiting their own consumption by saving. One (instinctive) purpose for doing
this is to create a reserve for times of need. Saving for a specific purpose is
another. If they lend their deposits with or without interest to another party,
they allow a matching increase in the level of consumption of the other party.
Where interest is charged, the borrower must pay both the capital and interest
back. The borrower does this as agreed either by increasing his productivity
or, if required, in turn reducing his level of future consumption. The choices
made by the two parties are entirely subjective. They are not subject to regulation.
The
bankers’ “spread” which covers the banks’ costs and profit as well as occasional
changes in their provision for bad debts need not change at all. As prices
stabilise, the rate of increase of
their volume of business should, however, decrease. The values of land ,
housing and rents, superannuation schemes, savings banks deposits, life
insurances, hire-purchase items would stabilise. Consumers’ confidence would
increase with their sense of economic security.
Governments
in democratic countries are periodically elected on the basis of programmes
including their promises about how they will manage public institutions and
protect the public interest. If voters perceive a government has done its work
well, the government may be returned to office. If voters are unhappy, they may
vote another government in. Contrary to what some past authors may have
believed 108, properly
functioning financial mechanisms are themselves independent of the political
orientations of the government currently in power.
105 Funded in part from government borrowing
rather than taxation. Military materiel is largely produced domestically in the
106 http:/www.newamericancentury.org The semi-official military and foreign policy
of the
107 The first great revolution was the
development of agriculture and associated land and property rights and the
second was the Renaissance and the development of science that has brought the
world, for better or worse, to where it is today.
108
Danks (1955) pp. 57-59.
10. CONCLUSIONS.
The
paper shows how exponential debt expansion in the financial system used
worldwide is caused by interest paid as unearned income on bank deposits. It
describes analytically for the first time the fundamental transfer mechanism
whereby the financial system “pumps”
deposits from the production cycle into the investment sector or paper economy.
This process leads to endemic systemic inflation in both the productive and the
investment sectors. In the current
economic system inflation is unavoidable except in the presence of substantial
current account surpluses.
Neither
the System of National Accounts (SNA)
nor orthodox economic theory provides a direct mechanism to manage systemic
inflation. Instead, orthodox inflation policy works through the investment
sector. Higher interest rates increase
systemic inflation while at the same time increasing deposit interest and
reducing purchasing power. The inflation transmission mechanism persistently
damages the profitability in the productive economy as inflation is temporarily
slowed by lower consumption, lower producer margins and higher unemployment. This is but one reason why using an Official Cash Rate
(OCR) to control inflation within our present system is fundamentally flawed.
While
some, mostly debt-free, individuals may succeed in hoarding financial reserves,
the existing debt system does not appear to allow for any aggregate earned
savings. As a result, earned savings
have to be offset by net borrowing of new capital, consumer or other non-productive
debt from outside the production cycle.
Speculative
global financial flows make current account imbalances worse and cause
instability by “chasing” large deficit, high yield currencies. This process
creates a self-reinforcing cycle of overvalued currencies, high interest rates,
and financial crashes especially where central banks rigidly apply very low
inflation targets.
Excessive
debt growth has now reached the point where the global financial system is
imploding because the productive economy can no longer satisfy the profit
expectations of the investment sector.
The
pool of unearned income in the investment sector does not usually mix with the
production cycle because there is a net financial incentive for unearned
interest deposits to remain in the investment sector.
An
economic debt model based on a revision of the Fisher Equation of Exchange
provides analytical support for the analysis given in this paper.
The
theory and model described in the paper allow, in principle, ready
quantification of debt expansion, systemic inflation, growth and the incentive
to invest.
Exponential
expansion of debt and prices can be slowed or stopped by reducing or removing
deposit interest from the financial system. This could be done on a
multilateral basis but is more likely to be implemented unilaterally.
Cultural
and institutional “capture” of economic debate may explain why the causes of
debt growth and inflation have not been closely examined before now.
11. REFERENCES AND BIBLIOGRAPHY.
BIS (Bank for
International Settlements) (2008, 2009), 78th and 79th
Annual Reports 30th June, 2008; 29th June 2009
respectively.
Brash D (1996) “”New Zealand’s remarkable reforms”, Address
by Governor of the Reserve Bank of New Zealand to the Fifth Annual Hayek
Memorial Lecture, Institute of Economic Affairs, London 4 June 1996.
Cecchetti SG,
Mohanty MS, Zampolli F (2010) “The
Future of Public Debt: prospects and implications”, BIS Working Papers No 300,
March 2010.
Claus I &
Grimes A (2003) “Asymmetric Information, Financial Mediation and the Monetary
Transmission Mechanism: A critical Review”, NZ Treasury Working Paper 03/19,
September 2003.
Danks A.J., (1955)
“What everyone should know about Social Credit”, Caxton Press.
Fisher, I (1912)
“Elementary Principles of Economics”
Fisher, I
(1930) “The Theory of Interest”
Macmillan
Fisher I
(1933) “The Debt-Deflation Theory of
Great Depressions”, Econometrica, Vol.
1, 1933, 337-357.
Friedman M, (1962) “Capitalism and Freedom”
International
Monetary Fund Balance of payments Manual 5th
Edition.
International
Monetary Fund (2010), Blanchard O, Dell’Ariccia
G, Mauro P “Rethinking Macroeconomic Policy” IMF Staff Position Note
SPN/10/03, February 12, 2010
Keen S (2010) The economic case against Bernanke 24th January
2010.
Keen S http://www.debtwatch.com
Liu H.C.K (2005)
“The Coming Trade War”, Asia Times on line, in 6 parts 15 June 2005-19 August
2005.
Manning L (2009), Financial system mechanics explained for the first time. “The Ripple
Starts Here.” Paper presented at the New Zealand
Association of Economists 50th Anniversary Conference July 1-3 2009.
North. D (2005)
“Understanding the Process of Economic Change”,
Palley T I, 2009 “
Perroux F. (1966) “L’Enterprise et l’economie du
XXe siecle” Presse Universitaire de France, Paris.
Preston D (2009) “Putting Credit back into Monetary Policy:
Reconstructing the New Zealand Monetary Policy Framework”, Paper for NZ
Association of Economists 50th Anniversary Conference, July 1-3
2009.
Reserve Bank of New
Zealand (2001), Woolford I, Redell M, Comber S, “International capital flows,
external debt, and New Zealand financial stability”, Financial Markets Department, RBNZ Bulletin
Vo 64 No 4 December 2001.
Reserve Bank of
Reserve Bank of New
Zealand, Bollard A, Hodgetts B, Briggs P Smith M, (2006), “Household savings
and wealth in New Zealand”, Paper for Alan Bollard’s presentation to
INFINZ Wellington 27 September, 2006.
Reserve Bank of
Reserve bank of new
Zealand (2008b), Lawrence G, The reserve bank, private sector banks and the
creation of money and credit” RBNZ Bulletin Vol 71, No 1 March 2008.
Reserve Bank of
Reserve Bank of
Reserve Bank of
Schultz, T (1971), “ Investment in Human Capital”, The
Free Press,
Snyder C, 1940,
“Capitalism the Creator”
Statistics New Zealand,
Bascand G, Cope J, Ramsay, D (2006) “Selected Issues in the Measurement of New
Zealand Saving(s)” Paper prepared for
RBNZ Workshop on Saving 14 November 2006.
Stiglitz JE, Sen Amartya, Fitoussi J-P (2009),
“Report by the Commission on the Measurement of Economic Performance and
Social Progress”, September 2009.
Strange, S (1966), “The
Retreat of the State: The Diffusion of Power in the World”,
Tily, G (2007),
“Lord Robbins, Monetary Reform and Keynesian Economics”, Paper given at London
School of Economics Conference on Lord Robbins 10-11 December 2007.
Tily, G (2009) “The
policy implications of the General Theory”, Real-World Economics Review. Issue
No 50.
Tripe. D (2009), “
12.
ACKNOWLEDGEMENTS.
The
author gratefully acknowledges the support and advice of John Walley and Les Rudd and the New Zealand
Manufacturers and Exporters Association (MEA). Thanks to Raf Manji and the
Sustento Institute for their encouragement and advice and to Terry
Manning and the NGO Bakens Verzet whose editing and constructive critique have
been crucial as the paper has evolved over time.
More information on monetary reform :
NEW Capital is debt.
NEW Comments on the IMF (Benes and Kumhof) paper “The
Chicago Plan Revisited”.
DNA of the debt-based economy.
General summary of all papers published.(Revised edition).
How to create stable financial systems in four
complementary steps. (Revised edition).
How to introduce an e-money financed virtual minimum wage
system in New Zealand. (Revised edition) .
How
to introduce a guaranteed minimum income in New Zealand. (Revised edition).
Interest-bearing debt system and its economic impacts.
(Revised edition).
Manifesto of 95 principles of the debt-based economy.
The Manning plan for permanent debt reduction in the national economy.
Missing links between growth, saving, deposits and
GDP.
Savings Myth. (Revised edition).
Unified text of the manifesto of the debt-based
economy.
Using a foreign transactions surcharge (FTS) to manage the
exchange rate.
(The
following items have not been revised. They show the historic development of
the work. )
Financial system mechanics explained for the first time. “The Ripple
Starts Here.”
Short summary of the paper The Ripple Starts Here.
Financial system mechanics: Power-point presentation.
Return to : Bakens Verzet homepage.
"Money is not the key that opens the gates of the market but the
bolt that bars them."
Gesell, Silvio, The Natural Economic Order, revised English edition, Peter
Owen,
![]()
This
work is licensed under a Creative Commons
Attribution-Non-commercial Share-Alike 3.0 Licence.