NGO Another Way
(Stichting Bakens Verzet), 1018 AM
SELF-FINANCING,
ECOLOGICAL, SUSTAINABLE, LOCAL INTEGRATED DEVELOPMENT PROJECTS FOR THE WORLD’S
POOR
|
FREE
E-COURSE FOR DIPLOMA IN INTEGRATED DEVELOPMENT |
|||||
Edition 01: 17 November, 2010.
Edition 02 : 08 August, 2011.
Edition 03 : Revised edition 07 September,
2011.
Edition 05 : 09 February, 2013.
(VERSION EN FRANÇAIS PAS DISPONIBLE)
Summaries of monetary reform
papers by L.F. Manning published at http://www.integrateddevelopment.org
NEW Capital is debt.
NEW Comments on the IMF (Benes and Kumhof) paper “The
Chicago Plan Revisited”.
DNA of the debt-based economy.
General summary of all papers published.(Revised edition).
How to create stable financial systems in four
complementary steps. (Revised edition).
How to introduce an e-money financed virtual minimum wage system
in New Zealand. (Revised edition) .
How
to introduce a guaranteed minimum income in New Zealand. (Revised edition).
Interest-bearing debt system and its economic impacts. (Revised
edition).
Manifesto of 95 principles of the debt-based economy.
The Manning plan for permanent debt reduction in the national economy.
Missing links between growth, saving, deposits and
GDP.
Savings Myth. (Revised edition).
Unified text of the manifesto of the debt-based
economy.
Using a foreign transactions surcharge (FTS) to manage the
exchange rate.
(The
following items have not been revised. They show the historic development of
the work. )
Financial system mechanics explained for the first time. “The Ripple
Starts Here.”
Short summary of the paper The Ripple Starts Here.
Financial system mechanics: Power-point presentation.
HOW TO
INTRODUCE AN E-MONEY FINANCED VIRTUAL MINIMUM WAGE SYSTEM IN
By
Sustento
Institute,
"The
government should create, issue and circulate all the currency and credit needed
to satisfy the spending power of the government and the buying power of
consumers..... The privilege of creating and issuing money is not only the
supreme prerogative of Government, but it is the Government's greatest creative
opportunity. …….The taxpayers will be saved immense sums of interest, discounts
and exchanges. The financing of all public enterprises, the maintenance of
stable government and ordered progress, and the conduct of the Treasury will
become matters of practical administration. …….. Money will cease to be the
master and become the servant of humanity."
[
“Financial
markets have worked hard to create a system that enforces their views: with
free and open capital markets, a small country can be flooded with funds one
moment, only to be charged high interest rates - or cut off completely - soon
thereafter. In such circumstances, small countries seemingly have no choice:
financial markets' diktat on austerity, lest they be punished by withdrawal of
financing”.
[Joseph E. Stiglitz “Taming Finance in an Age of Austerity” Published by Project
Syndicate, Monday July 12, 2010]
Key
Words: current account deficit, debt,
debt model, debt growth, deposit interest, domestic debt, domestic credit,
equity in society, exponential debt growth, Financial Transactions Surcharge,
Financial Transactions Tax, Fisher equation, foreign debt, FTS, FTT, inflation,
local currency systems, local economies, revised Fisher Equation, savings,
structural debt growth, systemic debt growth, systemic inflation, unearned
income.
ACKNOWLEDGEMENTS.
The
author gratefully acknowledges the support of Raf Manji and the Sustento
Institute for their encouragement and advice; and to Terry
Manning and the NGO Stichting Bakens Verzet (“Another Way”) whose editing and
constructive critique have been crucial as the paper has evolved over time.
CONTENTS:
01. EXECUTIVE
SUMMARY.
02.
THE ECONOMIC DILEMMA.
03. THE VIRTUAL MINIMUM WAGE
PLAN A.
04. PLAN A DETAILS.
05. THE FOREIGN TRANSACTIONS
SURCHARGE.
06. CONCLUSION.
07. APPENDIX 1 :THEORETICAL
BACKGROUND.
08. APPENDIX 2: THEORETICAL
SUPPORT FOR THE PROPOSAL.
09.
BIBLIOGRAPHY.
01 EXECUTIVE SUMMARY.
The main dilemma faced by today’s economic policy makers is that the
price-based financial system they have been using has run out of room to
manoeuvre. It is no longer possible either to substantially increase interest
rates to combat inflation or to reduce them to stimulate “economic growth”.
This paper offers a
practical plan to resolve the world’s problem of exponential debt growth and to
control inflation. The plan is based on a revision of the
well-known Fisher Equation of exchange enabling it to take account of
interest-bearing debt. It is designed to ensure that no substantial income
group in the community is worse off than it is now.
The plan focuses on
a substantial virtual increase in the minimum wage to stimulate demand among
low-income earners and enable them to repay credit card and other high-interest
consumer debt. The plan does not
directly increase the minimum wage.
The virtual wage
increase is merely a delivery mechanism to distribute low-income support by the
injection of E-notes or electronic currency into the banking system. The
electronic currency will be created debt-free by the Central Bank. Firms will
be granted a percentage of that low-income support for their participation in
the plan and to provide them with additional capital for future investment. In
this paper a figure of 20% has been used arbitrarily for the capital grant made
available this way to firms.
The virtual
increase in the minimum wage will continue step by step indefinitely. The
additional consumer demand created by the virtual minimum wage
increases will encourage economic growth in the usual way until full employment
has been reached. Once full employment has been reached
the economic stimulus might have to be slowed to avoid demand-pull inflation
unless it is sterilised through savings programs, such as, in
The modest
debt-free injection of purchasing power using E-notes will increase the demand
for labour, providing strong economic growth. The labour supply will be
provided from existing spare economic capacity. Prices should not change
because increases in production costs tend to be avoided. The plan is expansive
because firms can increase their production in the normal way subject to human
and physical resource limitations and consumption demand.
A
supplementary reserve ratio will need to be introduced to the banking system
over and above the existing Basel III risk-based capital adequacy requirements.
It will need to be large enough to sterilise the new e-note deposits in the
banking system, and also to support progressive lowering of the OCR (Official
Cash Rate). The banking system will
apply quantity controls on debt and money instead of using price controls through
interest rates as it does now. As the
OCR is reduced towards zero percent, the existing systemic inflation in the
economy caused by the payment of unearned income in the form of interest on bank deposits will in turn
drop towards zero.
Since
the plan is, or can be made, practically inflation free it will not measurably
increase the cost of exports. The plan
does, however, propose to introduce a variable Foreign Transfer Surcharge or
FTS starting at 10%. This would allow the
On the
basis of the preliminary debt model calculations for
Until
now, prices P in the revised Fisher equation (Manning, 2009) have been maintained
at the expense of output Q, as firms have sought to maintain or improve profits
by cost cutting and shedding labour. Some firms may soon have to begin reducing
prices P to maintain output Q at functional levels and still clear their market
02.
The
plan offers a practical and stable route toward on-going debt reduction with a
very low level of inflation in the economy.
The stabilisation and ongoing reduction in the nation’s total debt is a
fundamental objective of the plan. The improved equity and better living
standards from higher incomes are an integral part of the economic
transformation the plan will produce.
01 Foreign ownership Dca in the
model referred to and GDP have been tracking together in
02 The change in the speed of circulation Vy of the
circulating transaction deposits My in the revised Fisher equation referred to
is primarily structural. Vy tends to decline as the structures of the
payments systems changes. Except for secondary effects related to changes in
interest rates, circulating transaction deposits My must expand in the debt system if the
economy is to grow.
02. THE
ECONOMIC DILEMMA.
The body of work supporting this paper confirms
that a revised Fisher Equation of Exchange 03 and the Fisher Theory
of Interest (Fisher 1930) are sufficient
to explain why debt is expanding exponentially throughout the world and why
orthodox economics has failed to prevent unsustainable debt growth resulting in
boom and bust economic cycles interspersed with downturns and recessions. The
main difference between the revised Fisher Equation presented, which
incorporates the impact of interest-bearing bank debt, and orthodox economics
is that while the revised Fisher Equation is based on managing the quantity of
debt, orthodox economics is focused on the price of debt.
Both approaches eventually require the quantity
of debt to be regulated. The revised Fisher Equation shows that when the price
of debt, expressed as the average interest rate paid on bank deposits, is used
as a regulator, an exponentially growing pool of unearned income is created.
That pool of unearned income has to be funded by inflation in the productive
sector because unearned income, by definition, produces nothing itself. As long
as that pool of unearned income was relatively small compared with economic
output expressed as Gross Domestic Product GDP the interest cost could be
funded from increased productivity and economic growth. The result was an ongoing shift in wealth
from the productive sector to the investment sector, but as long as that shift was
corrected through socially acceptable income redistribution, the system
remained relatively stable. 04 As the world economy has become ever
more reliant on interest-bearing debt instead of cash transactions the impact
of unearned income on debt levels has increased exponentially.
Exponential “growth” curves are inexorable. What started as a relatively small effect has
rapidly become unsustainable throughout the world. In
Since the deposit interest on the pool of
unearned income Ms is funded by inflation and all price in the
productive economy is also inflation, the transaction deposits My funding the productive economy must increase at
least in proportion to the debt funding the pool of unearned income Ms. If My is increasing more slowly than Ms the productive economy must be deflating provided the speed of
circulation Vy of My is more or less constant .
03 Detailed in Appendices 1 and 2.
04 In practice, in many Western Countries like
the
In
many countries the transaction deposits funding the productive economy grow a
little faster than the debt funding the pool of unearned income Ms because the former includes
new My deposits needed to fund endogenous growth. The relationship between the
productive deposits My and the pool of
unearned income Ms is a good indicator of a nation’s economic
health. That relationship can become distorted when excess “debt bubbles” build
up in the productive economy from time to time, producing the now familiar boom
and bust cycles.
Excess
bubble debt is produced by failure by the banking sector to properly align
demand for credit with the productive capacity of the economy. It arises in
In the
present debt-based financial system, the productive economy has to replace the
deposits it loses to the unearned income investment sector My. While the unearned income deposits migrate to
the investment sector, the corresponding debt backing Ms remains in the productive sector.
To replace the deposits lost as unearned income the productive economy must
borrow a new amount at least equal to what has been alienated from it as well
as enough to fund the next tranche of deposit interest 05.
During
booms there is excess debt in the productive system that affects both the rate
of increase of the pool of unearned income Ms and the bubble dent Db shown in the debt model. By and large, Ms has followed My so closely in the debt model arising from the
revised Fisher Equation because virtually all the nominal GDP growth in New
Zealand over the past 30 years has been funded by offshore borrowing as
demonstrated in “The Interest-Bearing Debt System and its Economic
Impacts” (Manning, 2010).
In
March 2011 the total domestic debt in
05 This simple concept lies at the core of the
world economic debate. Try it with counters. Start with 10 counters
representing unearned income deposits and 10 representing deposits in the
productive economy. The total debt is 20 counters. Suppose the unearned income
for the period starts at 1 counter. Shifting 1 from the productive economy to
unearned income leaves
06 The preliminary debt model calibration
shows the change in Ms exceeding the change in (My * 18) in each of the March years 2009, 2010, and 2011, indicating
a serious credit crunch, that can only be undone by increasing My by direct injection
(E-notes or electronic cash) into the productive sector. It is otherwise
numerically difficult to “grow” out of such a productive sector deficit because
of the high demand placed on the economy by debt servicing.
07 As in footnote 5 the amount added to My has to replace
the systemic inflation passed to the investment sector Ms plus add a
roughly equal amount to pay for the systemic inflation on the GDP.
08 It is difficult to achieve large
productivity increases in service based economies like those of
09 Further details are provided in Appendix 2 to this
paper.
From the March 2009 year through the March 2011
year there is little evidence of real expansion of
The dilemma faced by economic policy makers is
that the price-based financial system has run out of manoeuvring room. It is no
longer possible either to substantially increase interest rates to combat
inflation or for that matter to reduce them to stimulate “growth”. In
10 The OCR in New Zealand was 2.5% in August 2011. Its reduction to 1.5%, if fully reflected in
interest rates charged by banks to their clients, would increase growth by 1%.
03. THE VIRTUAL MINIMUM WAGE PLAN.
This
is an almost non-inflationary proposal to stimulate economic growth without the
need for radical change to the existing financial architecture. The key to the proposal is to increase
consumer purchasing power by increasing the circulating deposits (arising as an
increase in electronic cash ME in the debt model shown in the
Appendices) without significantly increasing prices and without causing any
growth in the pool of unearned income Ms.
a).
Increase the minimum wage to a VIRTUAL LEVEL of $20/hour, but leave
youth rates for those below 18 years of age at a lower level but above
$12.5/hour. The wage increase is virtual because the increase is paid through
employers but funded by a central bank cash injection into the economy.
Employers must pass the cash injection on to their employees. The higher
virtual wage is an instrument to deliver the cash injection of purchasing power
to those parts of the economy where it is most needed. The proposed increase
would potentially add about NZ$ 5 billion annually to disposable purchasing
power and 2.7% to GDP. The increase in GDP would be “real” growth stimulated by
greater purchasing power at more or less constant prices.
b). Supply new electronic cash (not debt) to businesses to fund the
virtual increase in the minimum wage, so there is no significant increase in price.
The new electronic cash deposits would circulate at the same speed as deposits
arising from debt. The first cash injection needed would be about NZ$ 5
billion/Vy =
5/18 or NZ$ 0,28 billion where Vy is the speed of circulation of the productive transaction
deposits My in the debt model. Since this amount helps cover
the deposit interest transferred to Ms , it must be repeated for very production cycle
leaving residual incomes available for
consumption and investment. It cannot be inflationary unless the total
aggregate amount exceeds the aggregate increase in Ms.
c).
Supply a corresponding injection to businesses to facilitate business growth,
to be paid to businesses weekly together with the planned virtual wage
increase. This supplementary support for businesses has been arbitrarily set at
20% of the virtual wage injection, that is 20% of NZ$ 5 billion, or NZ $ 1
billion/year.
d).
The planned increase in the virtual minimum wage income is largely expansive.
It does not increase systemic inflation because the E-note injection is not
interest-bearing debt. While it stimulates new productive activity by improving
business confidence the net injection will not be large enough to produce
significant demand-pull inflation. The circulating transaction deposits My in the debt model shown in the appendices does
not change because the new funds are injected in the form of electronic cash.
The proposed E-note injection will notionally support additional “real” GDP
growth of up to 2.6%. However, some of the deposits arising from the cash
injection will be used to reduce mortgage, credit card and other consumer
debt. As set out the plan details, E-note injection at about
the proposed level can be continued indefinitely.
e).
Use taxation revenue (about NZ$ 2 billion) from the up to 2.6% increase in
GDP to index social welfare and
superannuation payments to the higher VIRTUAL average wage. The virtual average wage will rise by $2/hour
to $25/ hour. This is based on June 09 NZIS income survey figures, which have
not changed significantly over the past year and represents a virtual wage
increase of about 8%. In
f). In
g).
Seek trade union agreement to keep real wage increases close to the inflation
rate 12. Such inflation-led
wage increases will apply to all workers in the usual manner, including those
receiving the virtual wage increase. Under the agreement the E-note injections
would be continued indefinitely as long as the rate of injection remains close
to or within the permanent growth capacity of the economy.
h).
Progressively extend the virtual wage increases. Many people will use some or
all of their extra income to reduce debt. The program could therefore be
continued until much, if not most, existing household debt is retired.
Increasing the virtual minimum wage from $20/hour to $23/hour will add another
$5 billion a year to lower incomes to enable the process to continue. Such
extensions should be possible because normal wage increases will progressively
reduce the size of the original injection as normal wages rise towards the
virtual minimum wage of NZ$ 20/hour. A third similar tranche, raising the
virtual minimum wage from $23/hour to $25/hour would follow the second, and so
on.
i).
The new cash deposits in the banking system could provide the base for
increases in bank lending. Supplementary reserve ratios will need to be
introduced into the banking system, over and above existing Basel III-based
capital adequacy criteria, so that bank lending can be managed by quantitative
means rather than by price. This will need to be done during the first year of
execution of the plan. The banking
system will progressively change the nature of its activities from credit
creation toward savings and loan intermediation.
j). To
reduce systemic inflation, progressively reduce the overnight cash rate (OCR)
based on measured macroeconomic outcomes towards zero %. This may require the introduction of a
Foreign Transactions Surcharge (FTS) to manage capital flows, as set out in the
plan details below.
11 In New Zealand the main contributors to
this are the Family Tax Credit scheme, which provides NZ$2.2 billion (2010)
annually, and the In-Work tax credit scheme, which provides NZ$0.6 billion
(2010) a year.
12 People with real wage rates above $20/hour
less inflation would initially get a pro-rata increase in their virtual minimum
wage to a level above the $20/hour virtual rate. If inflation were 3% and
someone was on a wage of NZ$19.70/hour, their wage would increase by 3% to
NZ$20.30/hour.
04. PLAN
DETAILS.
a).
Increasing the VIRTUAL minimum wage.
One
primary reason the New Zealand economy has not been growing very quickly is
that wages have not kept up with inflation in real terms and the benefits of
modest productivity increases have accumulated to the business gross operating
surplus instead of being passed on to employees.
The
increased virtual wage will stimulate increased production and reduce
unemployment. In the absence of full employment there will be little or no
inflationary pressure. The plan can be continued over time by increasing
workforce participation through greater innovation and productivity. It is also
an axiom of capitalism that people tend to work harder if they know they are
being rewarded for doing so.
Some
workers will use their extra income to reduce debt, especially high-interest
consumer and credit card debt, smoothing the initial positive impact of the
programme. This is a composite part of
the plan designed to reduce the country’s total debt over time.
Some
regulatory provision may be needed to prevent employers seeking to reduce wages, through the loss of jobs by workplace
attrition and subsequent replacement of workers at lower wages, or by failure
to negotiate or pass on the normal real wage increases agreed by wage
bargaining from time to time. Actions of
this type by employers would tend to keep their prices stable, but would lead
to higher injections of credit into the economy as discussed in point b) below,
eventually putting the plan at risk. As
discussed in point c) below, businesses will be well rewarded under the plan
and would be expected to support normal wage levels and normal wage increases
as well.
b).
Injection of electronic cash.
The
Central Bank does not need new legislative authority to make an injection of
electronic cash into the economy. The money in the proposed plan will be used
to
increase virtual wages. It is not a subsidy to business, though business
will be rewarded for its participation in the scheme and to stimulate business
development. The plan is a
non-inflationary way to increase wage-earners’ purchasing power. It is made
possible through the greater
understanding of the operating mechanisms of the existing interest-based debt
system provided by the debt model discussed in detail in the appendices to this
paper.
Each
business will have to demonstrate the number of qualifying employees it has who
earn below the proposed initial virtual wage threshold of $20/hour. That should be apparent from existing PAYE
(Pay As You Earn) tax data. The amount needed to bring wage earners’ pay up to
$20/hour will be deposited weekly into the firm’s business operating accounts
in a manner similar to ordinary government transfer payments together with the
corresponding incentive payment to be made available to businesses. Firms will
have to provide records (as part of their normal PAYE returns) to show that all
the money they receive has been used for its intended purpose. They will
continue to pay workers at their usual (pre-existing) rates of pay together
with any pay increases from time to time negotiated with the unions in the
normal way as wage inflation increments arising from increases in the cost of
living and increases in productivity.
Since
it is likely that a substantial part of the E-Notes injection will be used to
reduce existing consumer and credit card debt it is probable that the initial
programme can be continued over time and expanded beyond the virtual wage of
$20/hour.
Normal
wage increases will progressively erode the amount of the initial E-Note
injection providing an automatic “sunset” clause to the plan should a political
decision be made to discontinue it. To
maintain the effects of the initial E-Note injection, the virtual minimum wage
will need to be increased in tranches as set out below under point h) of the
plan or simply increased incrementally each year.
c).
Business participation.
In
many countries, the business gross operating surplus is 50% or more of the
purchase price of goods and services. It is therefore usually beneficial for
firms to expand production capacity as demand rises. There will be a reward for business
participation in the plan. The reward will take the form of a capital grant.
Businesses will be required to show how they use the capital grant provided to
them to increase productive capacity. All businesses employing wage and salary
workers will be eligible, not just those employing workers below the proposed virtual
minimum wage. The proposed level of 20%
of the planned initial E-Note injection of NZ$ 5 billion/year would provide an
annual capital injection to business of about NZ$ 700 for each FTE (Full Time
Equivalent) worker, or in round terms, about NZ$ 14 per worker per week. This would, in principle, continue as long as
the plan is operative and for as long as individual firms continue to invest in
increased production capacity.
d).
Inflation.
Since
the E-Note injection is not part of production costs firms can continue to
produce the same output as they do now for the same price. The E-Note injection will increase
wage-earners’ consumption capacity, stimulating further new production at
nominally constant prices. It does this by reducing the drain of incomes to the unproductive
investment sector leaving more of the earned incomes (both compensation of
employees and gross operating surplus) for consumption and investment. The need to increase consumption capacity in the short term arises from the
exponentially growing transfer of deposits from the productive sector My to the investment sector Ms. Increase in unearned income Ms will continue as long as interest continues to
be paid on deposits. Increasing debt
levels require an ever-higher proportion of incomes to cover interest payments
for debt servicing. The debt model presented in Appendix 2 shows there will be
a deficit in effective consumer demand in the economy whenever wage-earners’
net incomes fail to fully compensate for increased debt servicing costs and
inflation. This is especially the case
when the OCR is used to increase interest rates in an effort to manage
inflation, producing unemployment and a contraction in consumption and, over
time, a contraction of economic output.
When purchasing
power is increased modestly, the miracle happens as employees spend at least
some of their new income on consumption. Since prices remain very nearly the
same, the increased purchasing power induces added production using existing
unused resources available within the economy. The initial stimulus provided
does not need to be large. In practice it is a lot less than what has been used
in countries such as the
Normal
wage increases and new growth would initially continue producing systemic
inflation in
e).
Indexation of transfer payments including Superannuation.
Indexation
of transfer payments on a tax-neutral basis does not change the figures
referred to under points a) to c) above.
The higher virtual minimum wage level results in higher employee
incomes. A substantial portion of that wage increase is transferred back to the
government through taxation. The
government then redistributes that tax, leaving the global increase in
purchasing power intact, but further improving its spread amongst the
population. Some existing transfer payments should fall as the rate of
employment increases with economic expansion. People on other benefits should
become more motivated to seek work because the higher minimum virtual wage
allows them to escape the poverty trap 13. This plan assumes such
budget “savings” would be used to increase the transfer payments to the people
still needing them. Whether the government of the day chooses to increase the
present level of social welfare transfers and, if not, what it does with the
resulting ‘savings” becomes a matter for public policy debate.
f). Other
forms of income support.
As
lower income levels rise, the need for supplementary income support through
programs such as the
13 The term “poverty trap” refers here to
situations arising under the existing
14 In
g). Wage restraint.
The trade union movement is expected to be
strongly attracted to the plan because it will improve the purchasing power of
many of its members. A unique feature of
the plan is that it provides a systemic bottom up approach to reducing income
disparity rather than a top down approach.
The plan is neutral on taxation rates, which are considered to be a
political matter.
The plan does not remove systemic inflation from
the economy though it will reduce it over time through the reduction in the
OCR. As in the past, wages may increase to reflect price changes induced by
inflation as well as to allow employees to enjoy a share of increased
productivity. Such wage increases will
also apply to those benefiting from increases in the virtual minimum wage. They
are included in systemic inflation. The
whole economy will continue to inflate by an amount equal to the systemic
inflation, which is expected to be about 1.8% in
It would be advisable to keep annual wage
increases to less than 2.5%, that is, up to 1.8% for inflation (reducing as
inflation falls) and 0.7% for productivity gains.
An agreement with the unions would be helpful
because there will be some pressure to increase incomes above the median wage to
restore skill differentials in the labour market. Skilled employees should not
be worse off under this plan than they would have been without it. Upward
pressure among middle incomes could be dealt with by making the tax system more
progressive by adjust adjusting tax thresholds to maintain income
differentiation. 15
15 One way to do this would be to replace
existing taxation with a single
automatically collected Financial Transactions Tax (FTT) . The FTT would be deducted whenever
transfers are made out of any deposit account except a savings account in the
name of the same depositor. That would
raise “consumption” taxes by about 80% and allow all other taxes except
excise/social taxes to be abolished. FTTs are strongly progressive because they
would apply to all transactions, not just those in the productive economy.
Assuming total transactions of 1.8 x GDP, to raise, say, $65 billion would
require an FTT of around 19%, not much higher than the new GST of 15%.
h). Plan extension.
There
is enough spare capacity in
Most
New Zealanders on low incomes struggle to make ends meet now. The bulk of the
first cash injections will probably go into new consumption as they are
intended to do rather than into debt reduction. This will change as further
cash injections make debt reduction more feasible.
Economists
and political leaders throughout the world are calling for an end to
exponential debt growth. This plan does
that by progressive credit monetisation of the existing debt as well as by
permanently reducing the OCR (Official Cash Rate) towards zero, at which point
systemic inflation would be removed from the financial system.
i).
The banking system.
This
plan will progressively and significantly increase cash deposits in the banking
system. The difference between cash
deposits and deposits arising from debt is that cash deposits reduce the banks’
risk-based capital requirements thereby increasing their lending capacity. Nobody can default on a cash deposit because
it can’t be liquidated. Cash deposits remain somewhere in the banking system
unless they are used to repay debt. That
makes a credit (electronic cash) based financial system inherently more stable
than the existing debt-based system.
Bank
deposits will continue to increase, but at a slower rate than during recent decades.
The increased deposits will result from population expansion and from residual
systemic inflation. They will tend to be offset by increased productivity
derived from increases in employees’ purchasing power. The growth of debt in
the economy will reduce towards zero as the OCR is progressively reduced
towards zero, eventually eliminating most, if not all, exponential debt growth.
One
main element of past exponential debt growth has been the use of the price
mechanism to “manage” it. This has turned out to be a perverse system. The debt
model set out in the appendices shows how raising interest rates increases
systemic inflation instead of reducing it.
During downturns and recessions the systemic inflation is still there.
Higher systemic inflation is, however, masked by falling purchasing power
caused by higher debt financing costs, and falling production with aggregate
discounting of goods and services by producers leading to a reduction of their
gross operating surpluses. The systemic inflation is not visible in consumer
prices and therefore tends to go unnoticed and unmeasured.
Since
cash deposits increase banks’ nominal lending capacity this paper proposes
using variable supplementary bank reserve ratios to limit bank lending. This is
to avoid risk of added inflation caused by increases in circulating productive
transactions deposits My over and above what is needed to maintain real GDP growth within the
resource constraints of the economy.
There
is nothing new about reserve ratios for bank lending. Most countries still have
them in some form even though they have usually played a minor role in economic
management in recent years. How the supplementary deposit ratio to be
incorporated in the plan is framed is outside the scope of this paper. Its
purpose is to slow down the exponential growth of bank lending as new debt is
replaced by electronic cash injections so that systemic inflation can be
reduced and eliminated altogether over time.
Over
the longer term, household debt can be first stabilized and then gradually
reduced. The banks will be gradually transformed into savings and loan
institutions. This process will reduce systemic banking risk while at the same
time maintaining banks’ profit margins.
The
main change under the plan will be the elimination of unsustainable exponential
debt growth. This is what the world wants to happen. Unlike this plan, orthodox
economics offers no mechanism to achieve it.
j).
Reducing the OCR.
The
introduction into the financial system of electronic cash credit injections and
supplementary reserve ratios allows the OCR (Official Cash rate) to be
gradually reduced, and systemic inflation to be removed from the financial
system. The financial system becomes
based on the quantity of debt (and E-notes) rather than its price. The persistent problem of exponential debt
growth will be solved. Over time, interest-bearing debt can be removed entirely
from the financial system.
From a
systemic point of view, the decline in the OCR can be carefully managed to allow
the
The
plan does not, of itself, resolve either the current account deficits of debtor
nations or the current account surpluses of creditor nations. It does, however, provide a platform from
which the exchange rate and current account can be effectively dealt with using other options such as the
Foreign Transactions Surcharge (FTS) discussed briefly in Section 5 below.
The
plan has been conceived to avoid significant additional costs for exporters.
Except for tourism, most producers of
From
the structural macroeconomic point of view debtor countries clearly need to get
their current account deficits under control.
One mechanism to do this is by applying a variable Foreign Transactions
Surcharge (FTS) whereby a currency exchange surcharge is automatically
collected whenever domestic currency is converted into foreign currency. It would have no effect on export prices, but
it would increase effective import prices. The proposal would be made tax neutral
by reducing domestic taxation by the amount of the surcharge collected.
05. THE FOREIGN TRANSACTIONS
SURCHARGE (FTS).
It is advisable to introduce a Foreign
Transaction Surcharge (FTS) as soon as possible to protect against the export of
assets (financial leakage) offshore and progressively repay the nation’s
foreign debt.
An FTS would be
simple to administer 16. It has very rarely been used in the past 17.
Introducing a financial instrument such as the FTS is essential in the medium term
if offshore borrowing and related interest costs, which are among the main
causes of exponential inflation in
A broader issue is whether a
foreign transactions surcharge would contravene international financial
agreements. There are provisions in the relevant international World Trade
Organisation (WTO) protocols for countries to protect their balance of
payments. The GATT legal text, Article XI clause 1 appears to specifically
permit non-discriminatory taxes to be applied. Provision of funding is a
service that falls under the GATS protocols.
The so-called policy “trilemma” referred to in
paper 1(cited in Appendix 2) is important to any debate on the FTS. Obstfeld
(1998) put it this way: “In most of the world's economies, the
exchange rate is a key instrument, target, or indicator for monetary policy. An
open capital market, however, deprives a country's government of the ability
simultaneously to target its exchange rate and to use monetary policy in
pursuit of other economic objectives” 20.
16 The “beauty” of FTS is that it applies to
outward capital flows, not inward capital flows. Moreover, FTS is not a
“restriction” on capital flows , it is a universal tax on all outward
transactions.
17 It was used successfully in
18 As discussed briefly at page 12 of the
paper “The Interest-Bearing Debt System and its Economic
Impacts”.
19 Setting the parameters for that regulatory
framework falls beyond the scope of this paper.
20 See also Rosenberg, Bill “Financial Crises,
Trilemmas, and a Time to Rethink”, Foreign Control Watchdog, 120, (2009).
If the current account is to
be managed, some form of exchange management will be required. To restructure
the financial architecture as proposed in this paper, a tool such as the FTS
will have to be inserted at the currency exchange interface. Failure to do so could condemn the world to
economic ruin. It is now widely, if not yet universally, acknowledged the
current economic system is deeply flawed as suggested or implied in recent
articles from the Bank for International Settlements, the World Bank, and
leading economists like Joesph Stiglitz 21 and Paul Krugman.
The exchange management
instrument(s) would apply to all outward exchange transactions, not just
outward capital flows.
The proposed FTS is
not a tariff or trade barrier of any kind. Nor is it a restriction on capital
flows as such. It can be adjusted
Financial receipts
from the surcharge would be used to offset a corresponding amount of domestic
taxation (for example by reducing GST), to make the surcharge tax-neutral apart
from any receipts put towards foreign debt reduction. Its intent is to correct
the current account, which is part of the balance of payments as defined in the
legal WTO, GATT, GATS texts, by removing the existing subsidy enjoyed by those
engaging in foreign currency transactions at the expense of those who do not.
Those using foreign currency in
The proposal for an
FTS also deserves mention in the context of ongoing negotiations for a TPPA
(Trans-Pacific Partnership (Free Trade) Agreement) presently being negotiated
among eight
21 For example the Report of the United Nations (UN) Commission of Experts
on Reforms of the International Monetary and Financial System, 2009, chaired by
Joseph Stiglitz: (the “Stiglitz report”)
22 Under the gold standard, capital flows
appear to have been unrestricted, but they were not the dominant feature in
financial flows they have become in recent decades and current account imbalances were reflected in changes in gold
reserves.
23 The famous Bretton Woods meeting was where
the basis for the post World War II financial architecture was agreed among the
allied powers. The British position was effectively vetoed by the
24
25 For example,
26 The author of this paper is not aware of
any remission policy in cases where the PPMs (Process and Production Methods)
is MORE carbon efficient than the
corresponding
The overall saving
to the wider New Zealand economy from the introduction of an FTS is likely to
be more than the annual current account deficit itself
A foreign
transactions surcharge would cause the exchange rate to fall towards a stable
base level, allowing exports to increase and imports to decrease, providing a
more even playing field for local manufacturers and producers 28. At the moment they face a severe economic
disadvantage through the hidden costs represented in the status quo.
Introduction of the
FTS could allow the removal of all remaining tariffs and subsidies in the
The FTS can also be seen as a
correction designed to offset the unmanaged volatility in
27 Each 1% in interest rate alone
represents nearly NZ$ 3.1 billion per year on domestic credit of around NZ$ 310
billion, as at March 2011. Estimating the actual economic effect of FTS is outside
the scope of this paper, but, according to the System of National Accounts,
every dollar off the current account deficit is a national “saving” before
taking into account other benefits.
28 Rose (2009) notes that
exchange rates have relatively little influence on imports, but it is likely
that the FTS would act more directly on the import sector because it is visible
as it is drawn directly from bank accounts.
29 Source: Reserve Bank of
30 New Zealand National Accounts
for the year ended March 2009.
31 The outward payments could
fall from their present level and inward receipts would probably increase.
That would be enough to reduce
GST to 10% from 15% and begin foreign debt repayment
There would be a substantial
reduction in interest payments as the current account is brought under control,
the reduction of foreign ownership begun and inflation reduced to very low levels.
Rose (2009) notes: “Effectively the
market is pricing country and/or currency risk into national interest rates”.
On the other hand, the
That would produce a sharp fall in the exchange rate.
The FTS is a very powerful economic tool because of its indirect redistributive
impact within the domestic economy 34. Its introduction would also prevent a
reversal of the so-called “carry trade” 35 once domestic interest
rates have been reduced to low levels.
32 This could be done through
some form of tender process. The worked indicative
example for Option (B) at Table
33 The Keynesian transfer problem
implies the current account should go far enough into surplus to meet all transitional foreign investment
claims, though that might be optimistic in the short term.
34 On the other hand, debtor
countries may be better off “biting the bullet” and dealing with their foreign
debt sooner rather than later. Since the volume of exports cannot be rapidly
increased, the FTS must rely on changing the relationship between the NZ$ value
of exports and imports.
35 The carry trade is the
practice of transferring deposits from countries where deposit interest is low
to countries where deposit interest is high(er).
The share of the
“
That those annual servicing
requirements should be more or less equal to
Banks would quickly unwind
their dependency on foreign debt when the funding rate falls below what they
are paying offshore. Transitional
arrangements may be needed to favour the replacement of foreign funding with
domestic funding.
Some academic
literature supports the need for some form of foreign exchange management to
correct the balance of payments and the current account. “Pegged” exchange rates
have been widely used by major countries, including
Preston (2009)
argues that the levels of the
The FTS outlined
above is much broader in scope than
06. CONCLUSION.
The
paper sets out the underlying economic problems relating to the exponential
growth of debt and offers a detailed plan to deal with them. The private
interest-bearing debt-based financial system generates systemic exponentially
increasing transfers of wealth from the productive sector of the economy to the
investment sector. The transfers take
the form of net interest paid on bank deposits. The deposit interest has to be
funded from the productive economy. This causes an inflationary expansion in the
debt levels the productive economy has to service. Over the past few decades, the orthodox
economic approach to that inflationary expansion has been to increase the price
of debt by raising interest rates. Not only is that approach shown to be
counterproductive but debt levels in developed economies are now so high that
small increases in interest rates are enough to force them into recession. The
consequence it that interest rates now have to be reduced close to zero to
stimulate the economy.
The
proposed plan resolves the exponential debt problem. It is limited in its scope
to reducing debt in the economy and stimulating sustainable growth.
The
plan introduces the concept of a virtual minimum wage. In
Debt reduction
occurs as people receiving the stimulatory payments use some of them to repay
existing consumer debt and mortgages 36. Debt is progressively
replaced by electronic cash circulating in the economy at the same speed as
existing bank debt. The paper shows the
debt reduction process can probably continue indefinitely. The proposed cash
injections become self-limiting as normal wage increases reduce the difference
between ordinary wages and the virtual minimum wage. The plan can then be
extended by increasing the virtual minimum wage first from NZ$ 20/hour to NZ$
23/hour and then to NZ$ 25/hour. Each of
those extra increases has approximately the same effect as the original
increase to NZ$ 20/hour; being about 2.6% of GDP. The program can be continued in stages,
and progressively broadened until most
debt in the economy has been retired and
the economy is permanently
working at full capacity.
36 Injections by the Japanese Government failed
to adequately stimulate the Japanese economy in part because of the debt
substitution that took place. Instead of stimulating consumption some private
debt was replaced with public debt.
The plan is accompanied by at least two monetary
instruments. The first is the introduction of a supplementary deposit ratio
into the banking system and the second is the introduction of a foreign
transactions surcharge to manage the current account and retire foreign debt.
The supplementary deposit ratio is applied in
addition to the Basel III risk based capital requirements under which the
banking system operates at present. The
supplementary deposit ratio enables the effect of the E-note injection to be
sterilised (offset) so that new bank lending is correspondingly reduced. This eliminates the possibility of inflation
being caused by an oversupply of new interest-bearing bank debt as the Official
Cash Rate (OCR) is reduced towards zero.
Lowering the OCR will progressively remove systemic inflation from the
economy.
The Foreign Transactions Surcharge (FTS) serves
two main purposes. The first is to limit any capital flight as the OCR is
reduced. The second is to provide a powerful ongoing instrument to regulate the
exchange rate and progressively repay the nation’s foreign debt. The FTS is a variable tax on all outward transfers
of NZ currency. It would start at about 10% and be automatically collected
through the banking system. The income received would be used to reduce
domestic taxes, such as GST, and to begin reducing foreign ownership. The proposed 10% initial level for the FTS is
much lower than the recent percentage variations in the NZ$ exchange rate. The
proposed FTS rate would apply to ALL exchange transactions including
speculative financial transactions. It
appears to come within the context of existing international protocols such as
GATT and the WTO that allow for protecting a nation’s balance of payments. It
is important that this position be reserved in any TPPA (Trans-Pacific Partnership Agreement) the
country decides to enter into.
07. APPENDIX
1 : THEORETICAL BACKGROUND.
The
first paper of this series “The Interest-Bearing Debt
System and its Economic Impacts” 37 looked at the fundamental
cause of exponential debt growth and proposed several key concepts:
(a) The fundamental debt problem is that the
economy has institutionalised the payment to deposit holders of unearned
income.
(b) That unearned income takes the form of interest
paid on bank deposits.
(c) Interest paid on bank deposits creates
systemic inflation and exponential increase of the debt burden.
(d) Culture
and institutional “capture” of the debt debate has made rational discussion of
the debt problem difficult.
(e) Sustainable debt levels cannot be achieved without removing most
if not all new deposit interest.
(f) Quantitative analysis can be provided using a new debt model of
the economy based on a revised form of the Fisher Equation of Exchange.
The paper “The Interest-Bearing Debt System and its Economic
Impacts” showed that the debt system in
The productive
economy is progressively becoming paralysed. The exponentially growing pool of
unearned deposit income is funded by inflation of the productive economy. The
unearned income investment sector is becoming so large that servicing the
nation’s total debt requires inflation close to the deposit interest rate 38.
The present situation has probably never arisen before, not even during the
depression of the 1930’s.
Orthodox economic
instruments such as the use of interest rates to manage inflation mask systemic
inflation at the cost of economic growth as shown in Figures 2 and 4 of
Appendix 2. The inflation cost is still
there and it is still being paid, but it is being paid in the form of lost
production and unemployment instead of showing up in prices.
Appendix 2 provides
detailed evidence of the current position for
The world’s
financial system is approaching a state of collapse and cannot be repaired
using orthodox economic theory. Orthodox
economics has failed to reveal the fundamental mechanisms at the root of the
debt problem or to offer any practical long-term solution to address it.
37 L.F.Manning, for Sustento Institute,
38 Some
of the inflation is masked by the current account deficit and offshore
borrowing.
08.
APPENDIX 2 : THE THEORETICAL SUPPORT FOR
THE PROPOSAL.
The theoretical basis for this
paper is the debt model shown below which is the same as the one described in “The Ripple Starts here….”39 and the first paper of this
series “The Interest-Bearing Debt
System and its Economic Impacts” cited above. The debt model is
based on the Fisher Equation of Exchange amended as follows:
While the debt
model is based on the volume of debt, it is unrelated to earlier volume-based
reform proposals like those of Social Credit that failed to offer a viable
theoretical basis to support them.
The premise in the
debt model is that the circulating deposits and cash My = Prices P * output q where q
is the quantum of domestic output produced by My over a single cycle. Taken
over a whole year, the SNA definition of Gross Domestic Product GDP is given in
the debt model by mathematically integrating the expression Pq* Vy, where Vy is the number of times the
circulating deposits and cash My are used during the year 40.
The SNA should
reflect an expression of the original Fisher Equation of Exchange as shown in
Figure 2 41. The only difference is that the money supply
M in the Fisher equation of exchange included hoarded cash, whereas in the debt
system shown in Figure 2 for practical purposes there is now very little cash
contributing to measured GDP.
In circulating cash
and deposits My cannot include
hoarding of debt beyond the term of the production cycle because all the
productive bank debt giving rise to My is conceptually repaid at the end of the cycle 42.
39. “The Ripple Starts
here….”
40. The contribution of cash transactions in industrialised countries is
now (very) small.
41. The Fisher equation has been very widely discussed in relation to the
economic difficulties arising from the sub-prime mortgage defaults in the
42. As previously noted, in practice there is a continuous flow of production
and consumption so the deposits and cash My are always
present, but they are being used in the production cycle, not hoarded.
At any point in
time there are five broad blocks of deposits in the domestic financial system.
They are:
Mt The transaction
deposits representing the productive debt My - M0y so:
My =
Mt + M0y (1)
Mca The accumulated
domestic deposits representing the sale of assets to pay for the accumulated
current account deficit.
M0y The cash in circulation
included in Mv and used to contribute to
productive output.
Ms The net after tax accumulated deposits arising from
unearned deposit income on the total domestic banking system deposits M3 (excluding
repos) 43.
(M0-M0y) Cash hoarded by the public and not used
to generate measured GDP.
In this paper the
total of these deposits, that is, Mt + Mca + M0y + Ms , is provisionally assumed to
be the M3 (excluding repos) monetary aggregate published by most central banks
monthly less the amount of cash in circulation M0 except for the part M0y that is included in My. In this paper M0y is assumed to have the same
speed of circulation as My. In industrialised countries,
the contribution of cash transactions to the measured output of goods and
services (GDP) has been declining in recent decades and their contribution to
the GDP has been provisionally calibrated for the purposes of this paper 44.
In this paper, the
total debt in the domestic financial system is assumed to be the Domestic Credit,
DC debt aggregate published by most central banks monthly.
At any point in
time there are four broad blocks of domestic debt in the domestic financial
system. Three of them together add up to DC such that:
DC = Dt + Dca 45 + Ds
(2)
Where
Dt The productive debt supporting the transaction
deposits Mt.
Dca The whole of the debt created in the
domestic banking system to satisfy the accumulated current account deficit 46.
Ds The residual debt to balance equation (2)
43. Repos refer to inter-institutional lending
44. More accurate assessment of the cash contribution to GDP over time
requires further detailed study.
45. Arguably the accumulated sum of capital transfers could be included
here, in which case the net international investment position (NIIP) would be
used instead of the accumulated current account. The decision affects the size
of the “residual” Db.
46. This is greater than the monetary deposits Mca because the banking system may have sold commercial paper to borrow
foreign currency to satisfy the foreign exchange settlement.
The fourth block of debt is :
Db, the virtual “bubble” debt, the
excess credit expansion or contraction in the banking system such that Ds - Db = the debt supporting the accumulated deposit interest Ms defined
above. Db can be positive or negative as discussed further below
in relation to Figure 5.
There is also a
fifth block of debt Is that is, conceptually, not bank debt .
Is, the total debt accumulated by
investors arising from Saving Sy = S/Vy.
The investor pays
the investment Iy =I/Vy = Sy = S/Vy to the producer and the money is used to
retire the outstanding part of My relating to the investment in
question. Conceptually the investor borrows the purchase price from employee
incomes and the business operating surplus. Except for households buying new
homes, the investor then becomes a producer, and the interest on investment Iy is included as a production
cost in the subsequent production cycle loans My.
The predicament of
new homeowners is quite different. They cannot service their debt because they
cannot, conceptually earn more than they were before they bought their new
home, because the home itself is nearly always unproductive. There is no new
income stream from their housing investment. If economic demand is to be
maintained, homeowners must, in aggregate, rely upon increasing house prices
and refinancing of their properties, creating an aggregate “pass the baton”
systemic increase in debt.
When non-productive investment assets
are traded there is typically a capital gain because of asset inflation on
investment (Dca + Ms + the property component of Is). The new purchaser pays more for the asset
because of asset inflation, allowing the seller to retire the outstanding
mortgage debt on the property.
By definition in this paper :
My * Vy = GDP
Ms = Ds
The cash contribution to GDP =
M0y * Vy. Therefore :
DC = (GDP)/Vy - M0y + Ms + Dca
+ Db (3)
Ms =Ds =
(DC – Dca ) – GDP/Vy + M0y - Db (4)
GDP = Vy *(DC - (Ms +Dca
+Db ) + M0y ) (5)
My = GDP/Vy
= DC - (Ms +Dca + Db) + M0y (6)
Where the terms are as defined
above.
Equations (3 ) to
(6) are all forms of the debt model developed in previous papers 47.
47. Links
are provided in the conclusion to this paper.
Ms is the same format as Ms in
the earlier forms of the model. It has been freshly calibrated. Unlike the
previous forms of the model equations (3) to (6) are general and include the
contribution made to the economy by cash transactions.
In equation (4),
all the terms except GDP/Vy = My and Db are known or can be estimated
with reasonable accuracy. For the purposes of equations (1) and (6) My can be approximated using trend-lines because it is small
compared with Ms. Db is unknown but can be
approximated through the calibration as in Figure 5. The calculations in
equations (5) and (6) involve the subtraction of large numbers to get
relatively small numbers, which leaves them sensitive to modelling and data
error.
If Ms , calculated as “the
accumulated deposits arising from unearned deposit income on the total domestic
banking system deposits M3(excluding repos) ”agrees more or less
with that calculated in equation (4), bearing in mind the value of Mb , the proposition that debt
growth is determined by deposit interest will be proven. The model will require
further calibration as further data becomes available. Despite that, it is self-evident Db will be positive during periods of rapid expansion,
particularly as bubbles form, and will become negative during periods of rapid
contraction, particularly as bubbles collapse. The classic case of this in
The dependence of
the gross domestic product (GDP) on the Domestic Credit DC and the interest
rate on bank deposits in the modern cash-free economy from which Ms is calculated has profound
implications for economics.
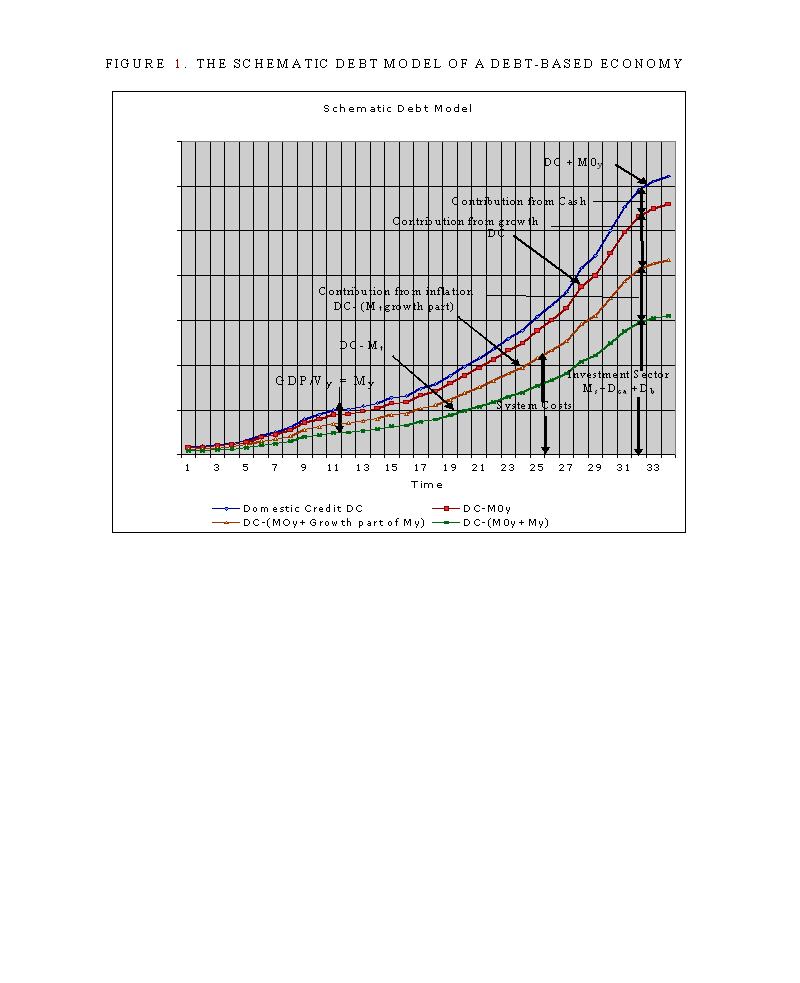
In the light of the
worldwide financial chaos of 2007-2009 the indicative debt model shown in
Figure 1 provides a powerful argument in support of public control of a
nation’s financial system.
Click here to view FIGURE
1 : THE SCHEMATIC DEBT MODEL OF A DEBT-BASED ECONOMY.
The vertical axis
in Figure 1 applies to the Domestic Credit for
It isn’t possible
to have a simpler model of the economy than equation (5):
My
=Nominal GDP/Vy equals domestic credit DC less (unearned net deposit
income Ms + the accumulated current account Dca + the
cash contribution to GDP M0y plus a correction for bubble activity Db
(+/-))
Domestic
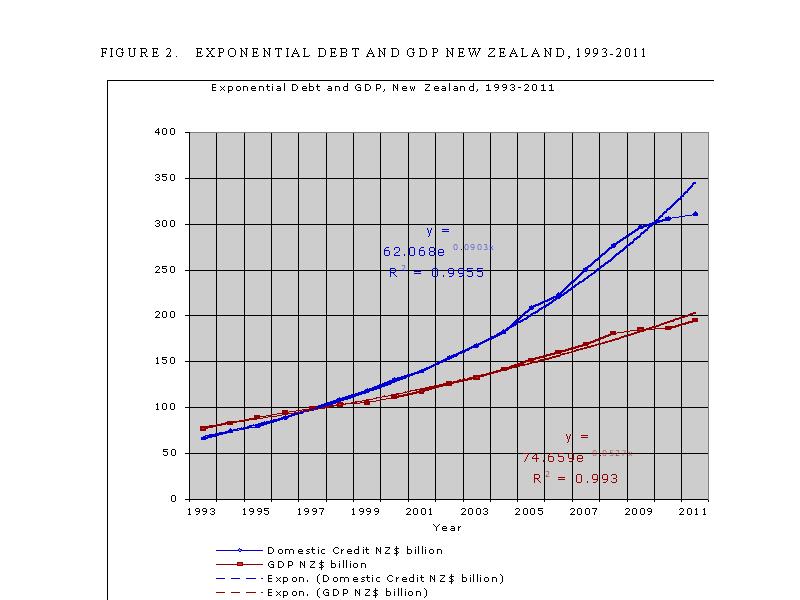
Click here to view FIGURE
2 : EXPONENTIAL DEBT AND GDP NEW
ZEALAND, 1993-2011.
It is theoretically impossible
to maintain exponential debt expansion faster than GDP expansion over an
extended period because the added debt servicing costs will always leave the
productive sector insolvent.
To avoid national
bankruptcy, each nation must maintain, in aggregate, a zero accumulated current
account deficit.
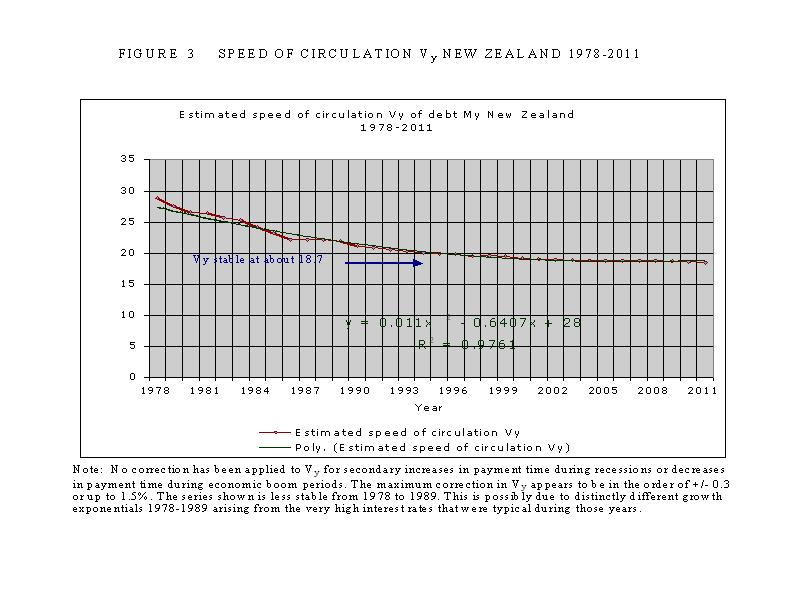
A first
approximation for the speed of circulation Vy of productive debt plus cash
transactions My is given in Figure
3. Vy varies with the
change in the payments systems. Minor secondary shorter-term cyclical variability
also occurs through changes in the average time taken to pay bills. When times
are tough people take longer to pay their bills, and each change of a day in
the time taken to pay them can alter Vy by perhaps 0.25%.
The process is usually reversed in better times. Otherwise Vy reached a constant value of
about
48. Vy is estimated at the moment
so the present figures are indicative. Once further research accurately refines
the present estimates, Vy will be
sufficiently accurate for predictive purposes.
Click here to view FIGURE
3 : SPEED OF CIRCULATION Vy NEW ZEALAND 1978-2011.
Note that in Figure
3, no correction has been applied to Vy for secondary increases in
payment time during recessions or decreases in payment time during economic
boom periods. The maximum correction in Vy appears to be in the
order of +/- 0.3 or up to 1.5%. The series shown is less stable from 1978 to
1989. This is possibly due to distinctly different growth exponentials
1978-1989 arising from the very high interest rates that were typical during
those years.
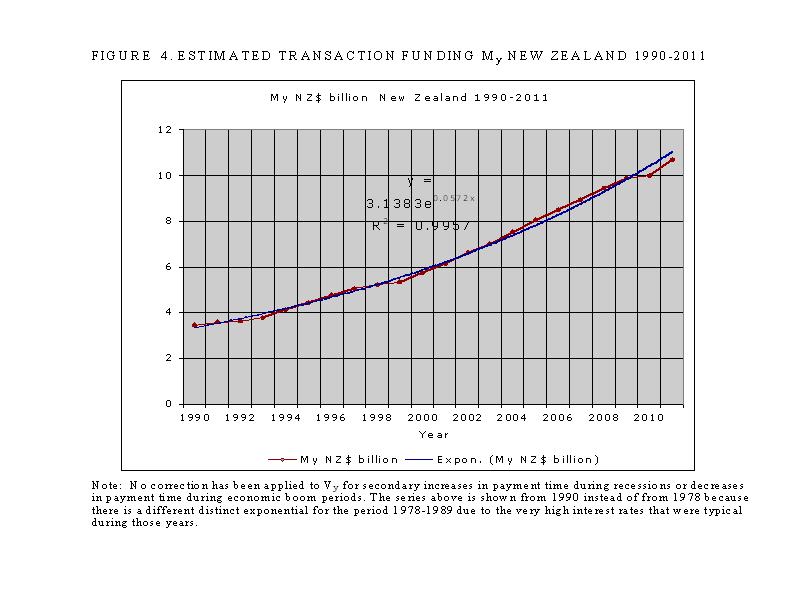
As shown in Figure 4, My in
Click here to view FIGURE
4 : ESTIMATED TRANSACTION FUNDING My NEW ZEALAND 1990-2011.
The methodology
used to calculate Vy in Figure 4 is as
follows. The GDP in
Businesses pay
suppliers monthly, and indirect payments are usually made on a monthly basis
too, so their speed of circulation is about 12 on average. Most workers get
paid fortnightly (though some get paid weekly and some monthly) so an average
speed of circulation of 26 has been assumed for that.
When the above figures are
weighted the weighted average speed of circulation is (12 * (42.7+12.3)+45 x
26)/100 = 18.3.
A similar estimate
of payment trends and a separate Vy calculation was made for each of the other years, and
a polynomial best fit curve was drawn as in Figure 4.
My was then obtained by dividing the official GDP figure by
the speed of circulation taken off the best fit trend curve. This gives the data series shown in Figure 5
and used when applying the debt model.
The methodology is
easily replicable using better information about payment trends and is
applicable to any country.
Figure 4 shows the
preliminary estimate for estimated production debt and cash My in
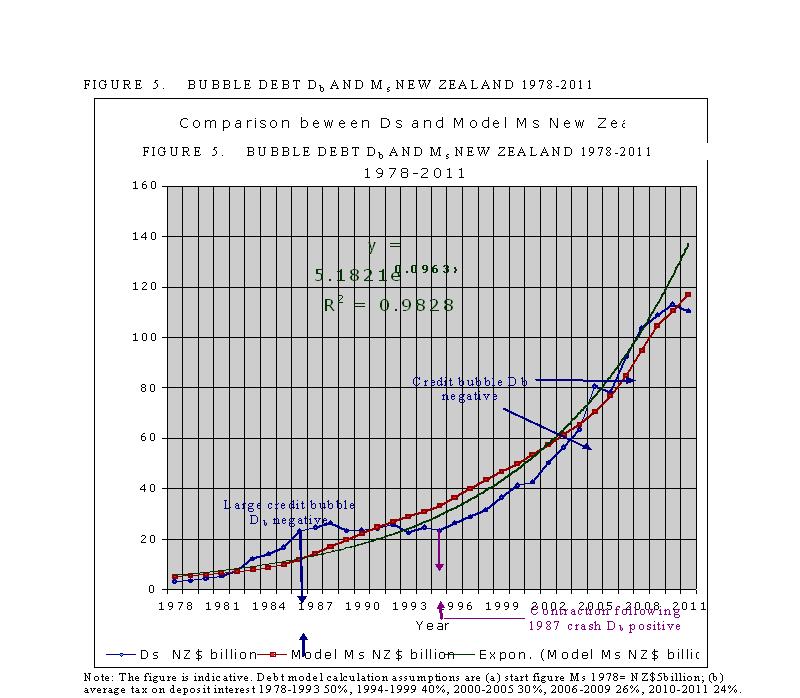
Figure 5 shows an
indicative comparison between the residual debt Ds for New Zealand calculated
from equation (2) and plotted against the model Ms calculated as the accumulated
after tax deposit interest on M3 (excluding repos). The curve for Ms is a first approximation
because assumptions have been made on the average tax deducted from the gross
payments of unearned income (M3 (excluding repos x the average interest paid on
deposits). The tax is the average tax
paid by each income-earner on his or her total income. It is not the marginal
tax rate 49. The losses from the 1987 share market crash
in
Once the tax rates
on Ms have been
accurately calibrated, the size of any debt bubble Db can be immediately calculated. Measures can
then be taken to eliminate the bubble without risking any economic downturn.
Click here to view FIGURE
5 : BUBBLE DEBT Db AND Ms NEW ZEALAND 1978-2011.
09. BIBLIOGRAPHY.
Allsopp C & Vines D, (2008) “Fiscal policy, intercountry adjustment
and the real exchange rate in
Baker D (2008), “The Benefits of a Financial
Transactions Tax” Center for Economic and Policy Research, December 2008.
Bertram G (2009), “The Banks, the Current Account, the Financial Crisis
and the Outlook”, Policy Quarterly, Vol. 5 Issue 1, February 2009.
Brand C (2010), “Commission Calls for Tax on
Financial Transactions”, 6/April/2010.
Brash D (1996), . New Zealand and international
financial markets: have we lost control of our own destiny?” Address by Donald T Brash, Governor of the
Reserve Bank of New Zealand to the 31st Foreign Policy School,
University of Otago, Dunedin, 29th
June 1996.
Fisher I (1930) “The Theory of
Interest”
George H (1879) “An inquiry into the cause of
industrial depressions and of increase of want with increase of wealth... The
Remedy” Self published in
Kelsey J (Ed) “No Ordinary Deal: Unmasking the Trans-Pacific
Partnership Free Trade Agreement” Bridget William Books, 2010. ISBN
978-1-877242-45-0
Manning L (2009), “The Ripple Starts Here: Finishing the Past 1694-2009”, New
Zealand Association of Economists 50th Anniversary Conference July
1-3 2009, as published under a creative commons licence at www.integrateddevelopment.org.
Manning L, (2010) “The Interest-Bearing Debt System and its Economic
Impacts” Version 3, 18 August, 2010,
Sustento Institute, Christchurch NZ
with the assistance of MEA
(Manufacturers and Exporters Association of New Zealand) as published under a
creative commons licence at www.integrateddevelopment.org.
Obstfeld M (1998), “The Global Capital market: Benefactor or Menace?”
Draft April 27 1998.
Preston D (2009), “Putting Credit back into Monetary Policy:
Reconstructing the New Zealand Monetary Policy Framework”, Paper for NZ
Association of Economists 50th Anniversary Conference, July 1-3
2009.
Rose D (2009), “Overseas Indebtedness, Country Risk and Interest Rates”,
Policy Quarterly, Vol. 5 Issue 1, February 2009.
Unknown authors, (ca. 2000) “Alternative monetary policy
instruments”.
More information on monetary reform :
NEW Capital is debt.
NEW Comments on the IMF (Benes and
Kumhof) paper “The Chicago Plan Revisited”.
DNA of the debt-based economy.
General summary of all papers
published.(Revised
edition).
How to create stable financial systems in four
complementary steps. (Revised edition).
How to introduce an e-money financed virtual minimum wage
system in New Zealand. (Revised edition) .
How
to introduce a guaranteed minimum income in New Zealand. (Revised edition).
Interest-bearing debt system and its economic impacts.
(Revised edition).
Manifesto of 95 principles of the debt-based economy.
The Manning plan for permanent debt reduction in the national economy.
Missing links between growth, saving, deposits and
GDP.
Savings Myth. (Revised edition).
Unified text of the manifesto of the debt-based
economy.
Using a foreign transactions surcharge (FTS) to manage the
exchange rate.
(The
following items have not been revised. They show the historic development of
the work. )
Financial system mechanics explained for the first time. “The Ripple
Starts Here.”
Short summary of the paper The Ripple Starts Here.
Financial system mechanics: Power-point presentation.
Return to : Homepage
"Money is not the key that opens the gates of the market but the
bolt that bars them."
Gesell, Silvio, The Natural Economic Order, revised English edition,
Peter Owen,
![]()
This
work is licensed under a Creative Commons
Attribution-Non-commercial Share-Alike 3.0 Licence.