NGO Another Way (Stichting Bakens Verzet), 1018
AM
SELF-FINANCING, ECOLOGICAL,
SUSTAINABLE, LOCAL INTEGRATED DEVELOPMENT PROJECTS FOR THE WORLD’S POOR.
|
FREE E-COURSE FOR DIPLOMA IN INTEGRATED DEVELOPMENT |
|||||
Edition 01: 09 May, 2013.
(VERSION EN FRANÇAIS PAS DISPONIBLE)
Summaries of monetary reform
papers by L.F. Manning published at http://www.integrateddevelopment.org
The
referenced papers :
00. Summary of papers published.
01. Financial system mechanics explained for the first time. “The Ripple
Starts Here.”
02. How to create stable financial systems in four
complementary steps.
03. How to introduce an e-money financed virtual minimum
wage system in New Zealand.
04. How to introduce a
guaranteed minimum income in New Zealand.
05. The interest-bearing debt system and its economic
impacts.
07. The DNA of the debt-based economy.
08. Manifesto of the debt-based economy.
09. Unified text of the manifesto of the debt-based
economy.
10. Using a foreign transactions surcharge (FTS) to manage
the exchange rate.
11. The Manning plan for permanent debt reduction in the national
economy.
12. Comments on the (Jaromir Benes and Michael Kumhof) Chicago Plan Revisited Paper.
13. Missing links between
growth, saving, deposits and GDP.
COMMENTS ON
COMMENTS BY :
Sustento Institute,
EXECUTIVE
SUMMARY.
On balance it is
probably preferable to work directly with official statistics such as those
provided by the Reserve Bank of
Selecting data
tends to create a reporting bias.
The NZI paper
extends to 70 pages without providing an adequate visual overview of
The NZI report is
disjointed and hard to follow. It poorly illustrates the methodological
differences in the various data series.
NZI Figure 1 purportedly “shows
the best available estimates of the total international liabilities.....”
when the official national accounts data produced by Statistics New Zealand
(SNZ) plotted as Figure 2 below are readily available on line. The SNZ balance
sheet (BS) data apparently gives debt figures 9.2% higher than SNZ Balance of
Payments (BoP) data [NZI p. 4 RHS top]. The NZI use of the BoP data instead of
the BS data needs to be fully justified, while stock based figures that
include revaluations (as in NZI Table 1) may be useful but are not immediately
relevant to the nation’s current external debt position.
Figure 1 Gross/Net New Zealand Government Debt as % of GDP.
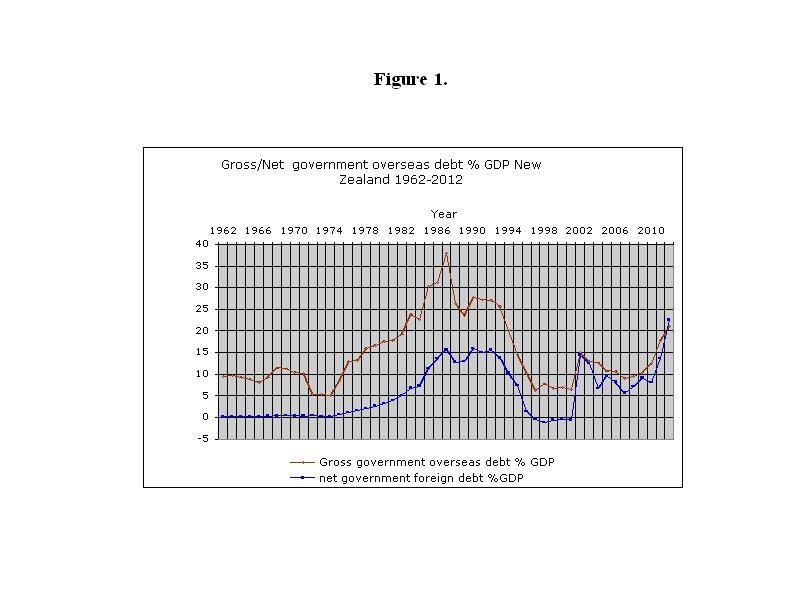
NB
The apparent discontinuity in 2001/2002 in Figure 1 could be related to the
fallout from the 9th September 2001 attacks in the
Figure 2 New Zealand Accumulated Net International Investment as % of
GDP.
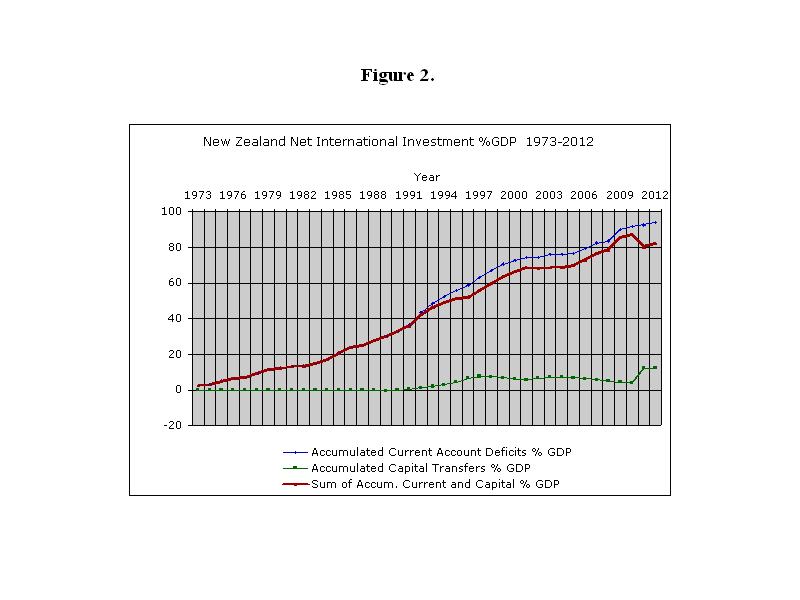
Source:
COMMENTS
ON PRELIMINARY PAGES OF NZI PAPER.
P. v : Foreword.
Free trade has to
be bounded so as to avoid large scale current account imbalances, but it is
not. One can have free capital flow but not asymmetrical capital flows. When
the outcomes are asymmetrical, trade and capital mobility do not constitute “a mechanism that creates prosperity for all”
as NZI claim, because the additional wealth the economy creates is being
drained offshore through foreign ownership of the economy.
P. vi : Import of
capital.
The NZI paper shows
“
The single key
event was when US President Nixon abandoned the US$ gold peg on August 15th
1971. The asymmetry in the world financial system could not have arisen were
the peg still in place because asymmetrical events would have forced
stabilising currency de(re)valuations. The more recent “floating” exchange
rates do not work in the face of unbridled speculative capital flows.
P. xiii : Key messages.
Key message 1.
In the early days
of
Key message 2.
The oil shocks did
result in current account deficits and consequential investment inflows. They were
not sterilised and resulted in increasing net overseas debt. The oil shocks
could not have happened prior to the abandonment of the
Key message 3.
The current account
problems have little to do with the 1970’s per se and everything to do with
over consumption (including that resulting form the oil shocks) and the “free
trade” policies the NZI paper appears to be promoting. Keynes argued in favour
of “balanced trade” at Bretton Woods in 1944 and was vetoed by the
Key message 4.
The NZI text is
wrong. The way to fix the investment and debt problems is to manage the
exchange rate and rebalance the broad balance of payments so New Zealanders can
buy back their country and enable other countries can do the same. That will
not be possible unless effective policy tools are implemented (like the
author’s proposed foreign transactions surcharge
(FTS)- the details of which can be found at www.integrateddevelopment.org ).
P. xiv : Myths about
International Debt and FDI.
Myth 1 : NIIP is negative
because domestic investment since 1973 has exceeded national savings.
Contrary to what
the NZI paper says, the causality is the current account deficit itself. The
“borrow and hope” program was indeed funded by foreign borrowing, and the
“think big” projects did involve foreign components and foreign companies.
Despite that, as shown in Figure 1 above, the external government debt to GDP
ratio rose faster before and after “think big” due to the 1970’s oil
shocks and the Labour government’s free for all in the mid 1980’s. Moreover,
external government debt was reduced (at huge public cost) to very low levels
through the 1990’s until the recent debt crisis began. The negative NIIP was
exacerbated by the deficits on international investment income caused by
increasing foreign ownership of the NZ economy, including the banks. The NZI
text (top left p. xv) is true in part, but it is not the government that is
borrowing abroad to fund fiscal deficits. The government has recently borrowed
abroad because it is cheaper to do that than borrow from the domestic banks.
The relatively high domestic interest rates are due to foreign ownership
draining the NZ economy. To be certain of this, the data in Figure 1 replicates
the gross and net government debt data for the 50 years ending 2012. The NZI
paper fails to show the (more appropriate) net government external debt
position. Net government debt as a % of GDP has never been excessive and
funding it, while substantial, makes up less than 15% of the present current
account deficit.
Myth 2 : NZ ‘s large negative NIIP arises because
since the mid 1970’s ‘we’ have been spending more than we earn.
The NZI argument is
misleading. It says that because the Balance of Trade has been in surplus
neither business nor the public is responsible for the deficits. Somehow that
means according to NZI that “ [b]y
definition, gross domestic spending on goods and services was less than gross
domestic production....”. This neglects all other spending on foreign goods
and repatriation of profits and interest and so on that are part of the current
account. The myth is absolutely true.
Myth 3 : NZ has a large
negative NIIP because New Zealanders are poor savers.
The NZI argument about myth 3
is also misleading. NZI says “national
saving has been positive for 38 out of the 41 years between 1972 and
“Saving rates in
In orthodox terms, New
Zealanders are relatively poor “savers”.
The issue is whether that poor saving affects NIIP.
There are always
“savings” because total productive incomes include those arising from new
capital development. Conceptually those incomes are “saved” and used to
purchase the capital items the economy produces. In practice, in the debt based
financial system, most capital items are funded by new bank debt. Most
“savings” from gross household and business incomes migrate instead to the
non-productive investment sector (equities, property, bonds and the like and
household debt servicing, especially to pay the unearned income on banks
deposits), or to pay for excess expenditure on the current account. The
accumulated current account deficit, which in
Myth 4 : NZ’s large negative
NIIP is due to the private sector.
This is not a myth
either. NIIP, primarily reflecting the accumulated current account deficit,
results from foreign ownership of the economy and the failure to bring the
current account and exchange rate under control. This is due to free market,
free capital flows, and so on. Foreign ownership has grown because NZ has lived
beyond its means while not fixing its current account problem.
“The sharp rises in the NIIP from 1974 to the
mid 1980’s was associated with heavy government net overseas borrowing”.
That is partly true as long as the word “associated” is not treated as being
the cause of the debt. The data appendix (AS 25) supplied by NZI starts from
2001. Myth 1 above and Figure 1 clearly show that net government external
borrowing was reduced to zero by March 1996.
On the other hand
there is a convincing argument that government debt is caused largely by the
periodic reductions in private sector tax rates. For the time being it have been
cheaper for the government to borrow abroad than to sell bonds to the domestic
banks or other institutions. This is why the banks themselves are borrowing
abroad now! The main point is that now, under a National led austerity
government, the private sector (households and businesses) is by far the main
driver of the NIIP, with the possible exception of the 2011 and 2012 years.
The NZI statement
(top p. xvi) “that the high NIIP today is a legacy of the policies and events of the
1974-1984 period” is untrue as a glance at Figures 1 and 2 above demonstrates. The net government
overseas debt was zero from mid 1990’s to 2001 through both national and labour
governments. In 1991 the
Myth 5 :
The text may be
referring to private NIIP debt. If so, NZI is implying that it doesn’t matter
if NZ is foreign owned, though it may be true that NZ “borrowers [have been] borrowing
unwisely – for the last 25 years” as NZI say. The NZI text then supports
the banks’ offshore borrowing!
Apparently they cannot be borrowing unwisely “given the intensity of the scrutiny they face”. The truth is
apparent. The banks borrow abroad for one reason: they profit from it because their offshore
borrowing costs are less than onshore deposit interest. There is no net
liability to the banks because they hold the equivalent NZ domestic exchange in
reserve. So contrary to the NZI text there is no moral hazard in the banks’
arbitraging as long as they have reasonable currency hedging in place.
Myth 6: NZ’s large negative
NIIP is due to banks borrowing to fund new housing.
That is a myth as
NZI claims. The accumulated current account deficit is due to NZ spending too
much and giving away ownership of its resources. The current account is funded
in the first instance by domestic debt. Once foreigners are paid, the
corresponding deposits return to NZ to buy whatever the foreigners want. The
sale of those assets leaves deposits in the hands of the domestic sellers. Most
of that money goes into inflating the non-productive investment sector,
including housing.
The NIIP is due
mainly to the current account deficit, not funding new housing. The investment
sector inflation is a consequence of the current account deficit, not its
cause.
Myth 7 : Attaining a fiscal
surplus 2014-15 will start reducing the current account deficit.
This is not a myth. A fiscal
surplus (that is : a theoretical ability to repay government overseas debt)
could enable the government to pay down its net foreign debt (Figure 1 above).
That would improve the net NIIP position. The repayment will not affect the
current account much because the government borrowing is a capital transaction.
These days, government debt is not typically used to pay for foreign goods and
services. It is, instead, used to pay for domestic goods and services and
transfer payments. Only the interest on the government foreign debt appears in
the current account. A reduction in the interest payments will reduce the current account deficit a little, though only a
pittance – a reduction of NZ$ 2b. in the capital account at 3% would improve
the current account by, say, NZ$ 60m. out of a current account deficit of some
NZ$ 10b.
Myth 8: Asians are
increasingly taking over NZ.
This is not a myth
either. While it’s true the vast bulk of Foreign Direct Investment (FDI) is not Asian,
NZI itself says Asian FDI is increasing. The free trade deal with
Myth 9 : NZ companies are not
investing offshore; NZ is open to takeover but it isn’t two-way.
There is an element
of truth in what the NZI text says but it is still misleading. Their Figure 3
shows inwards FDI “stock” at almost
50% of GDP and outwards “stock” at just over 10% of GDP (NZI Figure 3 p. xxiv).
The stock measures include revaluations that are internal balance sheet items
rather than cash-flow items. The NZI text therefore needs to be treated with
caution.
Myth 10:
This is definitely
a myth. The important point is that FDI should be limited to what serves the NZ
economy. Until now NZ has just been selling its economy.
Myth 11: Passive investment is
less useful than direct investment.
This is not a myth,
but neither is it especially relevant. NZI says “Foreign portfolio investment helps reduce the cost of capital in
Myth 12 : New Zealanders are
becoming tenants in their own country because of growing foreign ownership.
The NZI text is
utterly and deliberately misleading on this point because it refers only to
land. The economy is not land. It reflects the ownership
of the means of production. New Zealand’s productive capacity is already more
than 60% foreign owned where foreign ownership is measured as the accumulated
current account deficit/value of capital investment at cost. NIIP could also be
used. If the outstanding capital investment principal is used instead of
capital investment at cost, the extent of foreign ownership is even higher.
Since GDP= the outstanding capital investment principal as set out in the “DNA of the debt-based economy” by the author at website www.integrateddevelopment.org, monetised
production is dependent on the outstanding investment capital, not on the
unrealised value of land and property assets.
NZI discusses other
methodologies for assessing % foreign ownership in Section 2 of the main
document. Land (agriculture) contributes a relatively small portion to NZ GDP
despite its critical importance. The numbers for it are in the NZ national
accounts. In the
PP xix-xx : Key points : NIIP and indebtedness.
The NIIP numbers
NZI uses are misleading in part because they are distorted by more than NZ$ 16
billion capital inflows relating to the
The difficulty here
is that re-creating the status quo ante is called “investment” when it is
really more like maintenance and repair because the net value of NZ assets does
not increase as a result. At best they return to what was before the earthquakes. Moreover the BoP Manual 5 rules specify
that the whole insurance inflow from the
Perhaps that is why
NZI doesn’t mention the figures for the intermediate years in their text,
though they can be traced in table AS 25. Without that specific one-off NZ
$16b. “capital inflow”, the NIIP numbers would be at least 10% higher than
those shown in the NZI text.
When that 10%
correction is made together with the 9.2% from using the BoP method instead of
the BS method, the real NZ international debt equals the accumulated current
account deficit (94% of GDP in 2012) less a small deduction of about 4% for the
residual accumulated capital inflows, or about 90% of GDP.
The future path for
NIIP is not primarily “a function of the
earnings rate paid on the NIIP relative to the GDP growth rate” as NZI
claims. It is mainly a function of persistent current account (CA) deficits. By
inference, NZI seems to think it is fine if all the GDP growth leaves the
country in the form of those CA deficits. The nation as a whole is then left
the impossible task of sustaining the increasing drain of wealth into foreign
hands.
As described for
the “myths” above, the statement that “these
[NIIP] statistics indicate today’s highly negative NIIP is largely a legacy of
the prolonged deficit spending between 1976 and
P. xxi-xxii. Key Points :
Foreign Direct Investment.
The numbers offered
by NZI are largely meaningless when the official accumulated current account
deficit can be used as shown in Figure 2 above which is arguably more accurate,
especially over the earlier period.
The BoP manual and
commentary on it show that is has always been difficult to split current flows
from capital flows. In most countries the separation was not made at all for
most of the period 1962-2012.
No evidence is
provided for the statement that “the OECD
now considers
MAIN
DOCUMENT.
1. Introduction.
If NZ’s high “net external indebtedness has long troubled
policy makers and rating agencies alike” (p.1 RHS bottom) one would have
thought they would have something done about it, such as the author’s proposed foreign transactions surcharge
(FTS) information on which is available at www.integrateddevelopment.org.
2. Notes on key concepts and
relationships.
2.1 Terminological
distinctions and issues.
The NZI text [p. 4
RHS top] refers to SNZ Table AS 36 but
it doesn’t appear to be in the appendix. The table says the “estimated asset and liability positions are
higher for the BS [Balance Sheet] presentation by 9.2% of GDP on average [than
they are for the Balance of payments figures]”.
2.1.3 Derivatives.
SNZ measures of international
borrowing and lending include derivatives while the IMF measures of external
debt do not.
2.1.4 Overseas debt.
SNZ figures for
banks’ overseas debt are larger than Reserve Bank of New Zealand (RBNZ) figures
because SNZ follows IMF BPM5 that includes banks and other financial
institutions.
2.1.6 IIP measures.
SNZ/IIP stock based measures
rely on surveys. They can’t just be worked out from flow measures.
2.2 Key identities.
2.2.1 IIP Stock flow dynamics :
Closing
stock of investment = opening stock of
investment + Foreign investment over the intervening period + Valuation changes
during that period.
The stock number is
about “value” not debt. That means it is difficult to get a foreign debt figure
from a stock figure because valuation changes such as exchange rate changes,
financial derivatives valuation changes, market price changes, and “other
valuation” changes are unrealised. Nor is it clear whether those changes are
net of depreciation/ debt repayment.
NZI itself writes “If
the second and third items [of those mentioned above] have only a small effect,
the net investment flow will closely approximate the current account deficit
(or surplus) in the BoP.”
That is one reason why
the author of this paper uses the accumulated current account data as a first
approximation in his work. This is confirmed at NZI Table 4 p. 12 where the
current account deficit is funded by the net capital account inflow plus net
foreign investment inflow as used in Figure 2 above.
“Change in stock of investment as % of GDP=
(residual net investment flows plus valuation changes) as a % of GDP during the
intervening period plus (opening stock as a % of GDP for the same period times
the difference between the earnings rate and the rate of growth of GDP divided
by the proportionate growth rate of GDP)”. [sic?]
The calculations and text
giving rise to NZI Table 2 (p. 11) look dubious and there is a big typo error
bottom right of the table where the NZI text p.12 LHS top gives 72.1% not 62.9%.
2.2.3 Two identities linking the BoP to the
national income accounts.
That is dealt with
at great length in my paper on the “Savings
Myth” available at www.integrateddevelopment.org
which among other things shows that the use of capital consumption
(depreciation) as in NZI Table 5 is incorrect. Depreciation is a tax variable
not a value variable so it cannot satisfy the
BS stock-flow dynamics. [2.2.1 above].
3, Overview of the latest
statistics.
3.5 Degree to which NZ assets
are now overseas funded.
This is misleading.
The test is not the “capital stock including land and residential buildings”
but the country’s productive economy. A completely different result is obtained
if the ratio of the accumulated CA deficit to capital investment at cost shown
in the National Accounts is used. That ratio shows more than 60% foreign ownership
compared with 12% claimed by NZI (p. 26 LHS bottom). NZI then gives various
other flow “comparisons” such as (p. 26 RHS bottom) comparing “total income
paid overseas” NZ$ 14.9 billion to “operating surplus net of capital
consumption” NZ$ 57.2 billion giving 26% foreign ownership. It is not valid to
compare a net tax paid payment with a gross operating surplus because that
defies all basic accounting principles. Therefore, NZI Table 8 needs to be
taken with a grain of salt because none of the numbers appears to
reflect the true status of foreign ownership.
4. Comment on the historical
record pp. 30-45.
4.1 Nineteenth century.
Interesting but not relevant
to today.
4.2 Early twentieth century.
Ditto. Blanket foreign exchange
and import controls imposed in 1938 (Reserve Bank formation, Labour government)
changed the debt profile.
4.3 1950-mid 1980’s The
protectionist years.
The following quote
gives the flavour of the text: (p40) “It
was not important if the costs to NZ consumers were very high because
successive governments made sure consumers had little or no choice”.
The foreign
ownership of NZ business and assets resulting from free trade hardly offers a
better choice. Moreover, any claimed positive effects of the “choice” are short
lived as is now apparent from the progressive loss of real purchasing power
arising from foreign indebtedness. Nash (as expressed in the text at the bottom
of NZI p. 40) was probably closer to the truth.
Current account
deficits used to be limited through the application of the
Section 4.3.3 1970’mid 1980’s-
Big Deficits - is about escalating debt.
This is the “spend,
borrow and hope” period discussed in the preceding pages of these notes. NZI
forgets to mention that almost the whole world went through the oil shocks and
the huge deficits and inflation they created. That’s where the sea of
petrodollars came from! What does NZI think that little NZ should have done?
Of course imports
exceeded exports for most of this period
“
The NZI figures
bear no relationship to the figures in Figure 2 of this paper. Figure 2 is based on the official national accounts
and shows that the increase slowed after the oil shocks. It rose again later
under both Labour and National governments. As previously stated, the primary
reason for that was the deregulation and globalisation that followed after the
4.4 1985-95 Fiscal
Consolidation and Liberalisation.
The COST of the
liberalisation has been the sale of
Much of the text p.
43 RHS relating to the benefits of selling off State assets is false. Yes, the government foreign debt was reduced.
That was not achieved from the asset sales but from the vicious austerity
imposed on most of the public. Moreover, as the text itself acknowledges NZI
RHS p. 44: “Selling assets such as ... to overseas investors and using the proceeds
to reduce foreign currency denominated government debt does not alter the net
external liability but it does change its composition”.
The ideological
bias of the NZI document is there in Orwellian terms for all to see. That
ideology is why we have such an escalating current account problem today due to
the vast asymmetry between inwards and outwards flows.
4.5 Post 1995-2012 : The Mixed
Member Proportional Representation (MMP) era.
According to NZI NZ
has somehow “lost competitiveness” because of MMP! NZI blames MMP for the post 2009 fiscal
deficits – as if NZ created the world debt crisis. In fact, the recession in NZ
was 100% self-inflicted. Banks directly caused the recession by failing to pass
on Reserve Bank interest rate cuts in favour of boosting their loss reserves,
thereby squeezing credit. NZI does, however, highlight the risk of increases in
external liability (bottom RHS p. 44).
END
OF FILE
THE REFERENCED PAPERS
The
referenced papers :
00. Summary of papers published.
01. Financial system mechanics explained for the first time. “The Ripple
Starts Here.”
02. How to create stable financial systems in four
complementary steps.
03. How to introduce an e-money financed virtual minimum
wage system in New Zealand.
04. How to introduce a
guaranteed minimum income in New Zealand.
05. The interest-bearing debt system and its economic
impacts.
07. The DNA of the debt-based economy.
08. Manifesto of the debt-based economy.
09. Unified text of the manifesto of the debt-based
economy.
10. Using a foreign transactions surcharge (FTS) to manage
the exchange rate.
11. The Manning plan for permanent debt reduction in the national
economy.
12. Comments on the (Jaromir Benes and Michael Kumhof) Chicago Plan Revisited
Paper.
13. Missing links between
growth, saving, deposits and GDP.
Return to : Bakens Verzet
Homepage
"Money is not the
key that opens the gates of the market but the bolt that bars them."
Gesell, Silvio, The
Natural Economic Order, revised English edition, Peter Owen,
This work is licensed
under a Creative
Commons Attribution-Non-commercial Share-Alike 3.0 Licence.