Director,
T.E.(Terry)
Manning,
Schoener 50,
1771 ED
Wieringerwerf,
The Netherlands.
Tel:
0031-227-604128
Homepage:
http://www.flowman.nl
E-mail:
(nameatendofline)@xs4all.nl : bakensverzet
and
"Money is not
the key that opens the gates of the market but the bolt that bars them"
Gesell, Silvio The
Natural Economic Order
Revised English
edition, Peter Owen,
“Poverty is created scarcity”
Wahu Kaara, point 8 of the Global Call to Action Against Poverty, 58th
annual NGO Conference, United Nations,
08.00 Files of some specific aspects of the project.
|
PAGE |
PROJECT FEATURES |
|
|
03.00 Project background |
|
|
|
|
|
|
|
|
|
|
|
|
|
|
05.10 Social structures |
|
|
|
|
|
|
|
|
|
|
|
|
|
|
05.30 Service structures |
|
|
|
|
|
05.32
Sanitation structures, including organic and inorganic waste recycling
structures |
|
|
|
|
|
06.00 Phases of project execution. |
|
|
|
|
|
|
|
|
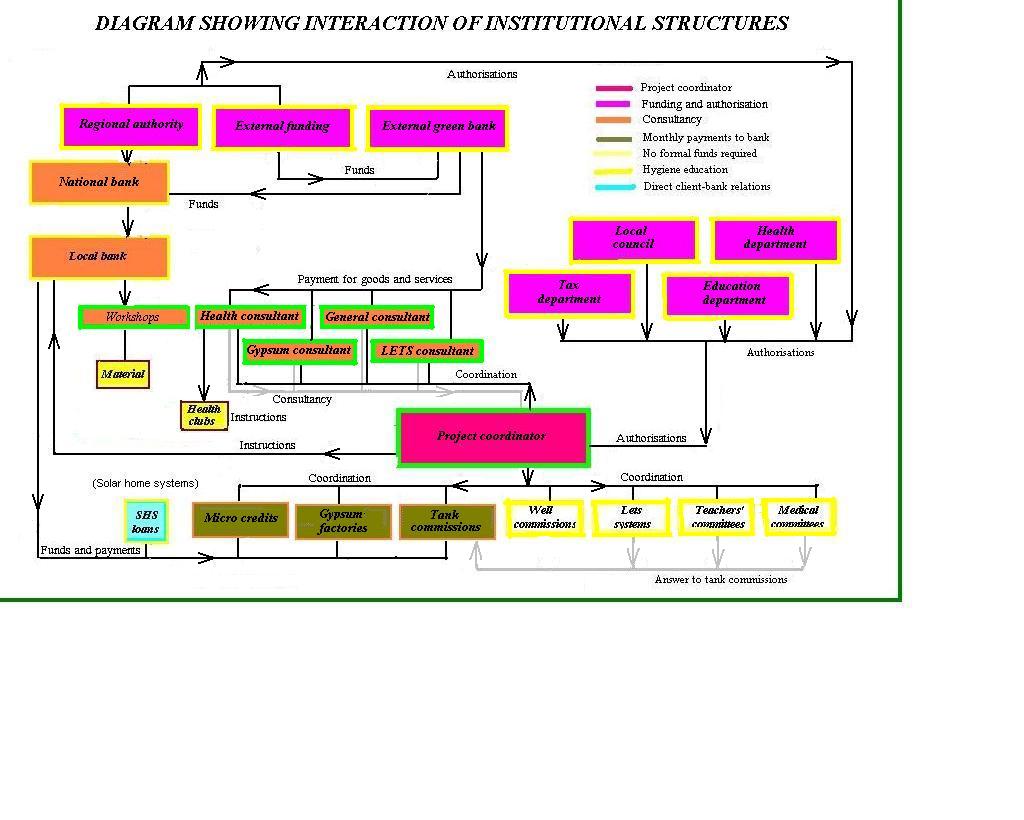
The distributed drinking water supply structures are the structures which
need the largest formal money capital investments. They will defined by the
people themselves during a capacitation
workshop following the formation of most of the other structures planned. The
following general indications are therefore subject to changes, some of them
important, from one project application to another. The following information should, however,
give a fair idea of the size and nature of
project applications.
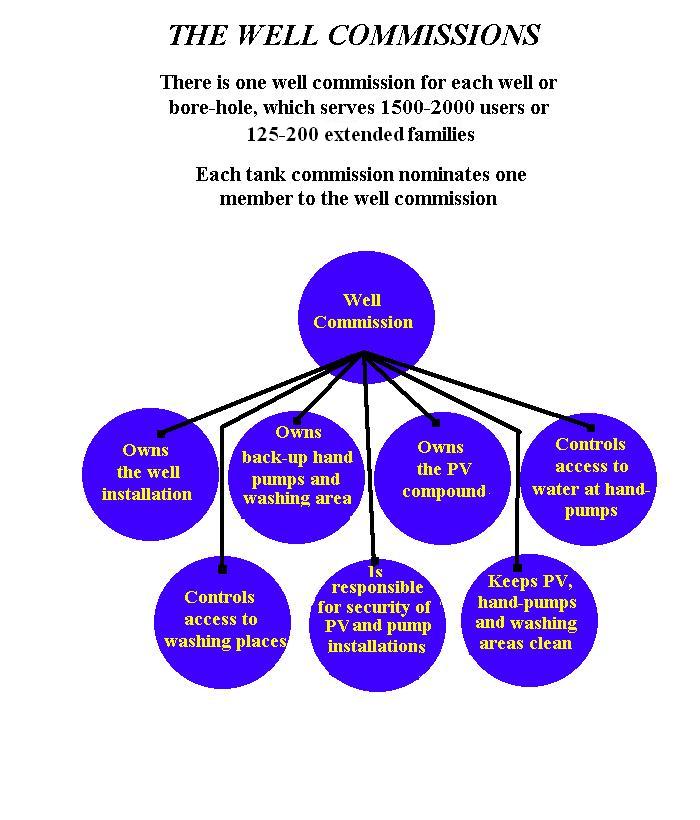
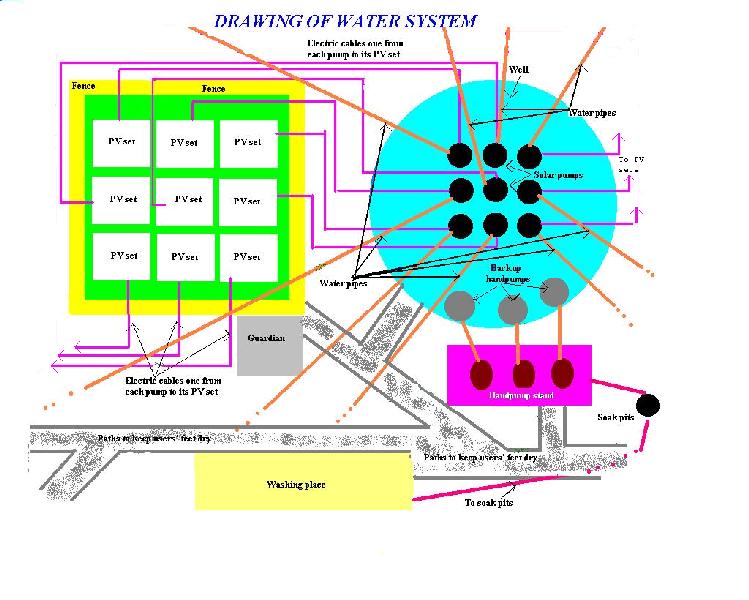
See drawings:
PROJECT STRUCTURES
TANK COMMISSIONS – THE KEY STRUCTURES
WELL COMMISSIONS
DRAWING OF DRINKING WATER SUPPLY STRUCTURES
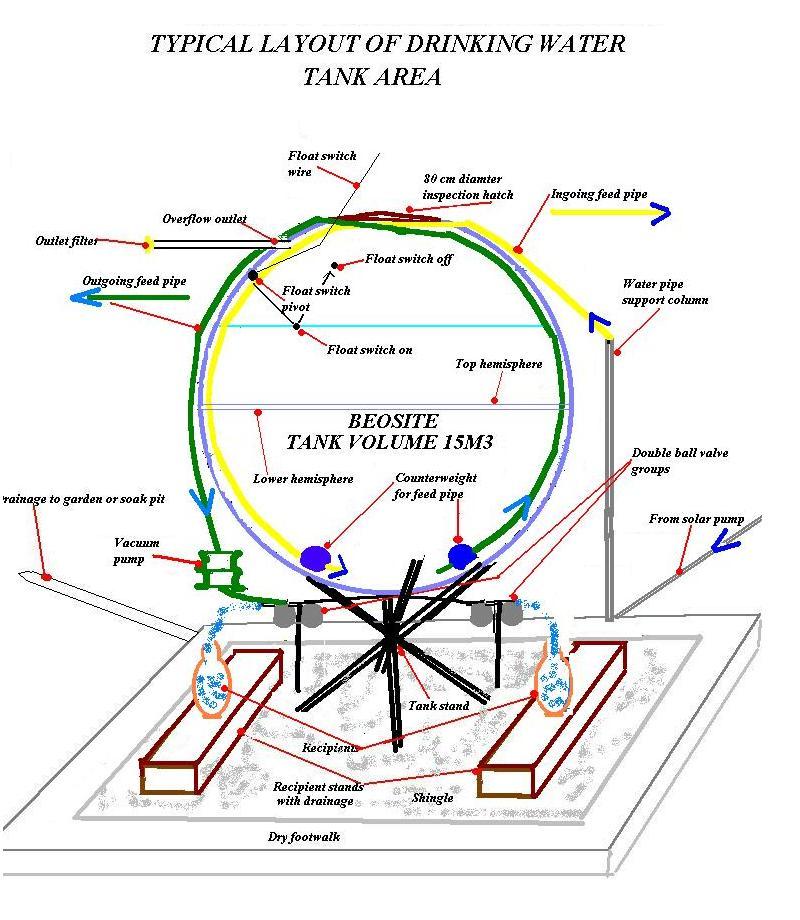
DRAWING OF A DRINKING WATER TANK INSTALLATION AREA
DRAWING OF COMPLETE WASTE RECYCLING STRUCTURE
|
1 |
2 |
3 |
4 |
5 |
6 |
7 |
8 |
9 |
10 |
|
Sublocations |
Inhabitants |
m3/day |
New wells boreholes |
Existing wells and boreholes to be upgraded |
Solar pumps |
Hand pumps |
PV panels Watts installed |
Schools Clinics Markets Pumps |
PV panels Watts installed |
|
01.0 Nyaguta |
|
|
|
|
|
|
|
|
|
|
|
|
|
|
|
|
|
|
|
|
|
1600 |
40 |
1 |
0 |
7 |
3 |
2100 |
1 |
300 |
|
|
2194 |
60 |
2 |
0 |
10 |
6 |
3000 |
2 |
600 |
|
|
1455 |
40 |
1 |
0 |
6 |
3 |
1800 |
2 |
600 |
|
|
|
(5249) |
(140) |
(4) |
(0) |
(23) |
(12) |
(6900) |
(5) |
(1500) |
|
02.0 Matunwa |
|
|
|
|
|
|
|
|
|
|
|
|
|
|
|
|
|
|
|
|
|
1100 |
35 |
1 |
0 |
5 |
3 |
1500 |
2 |
600 |
|
|
1081 |
30 |
1 |
0 |
4 |
3 |
1200 |
0 |
0 |
|
|
|
(2181) |
(65) |
(2) |
(0) |
(9) |
(6) |
(2700) |
(2) |
(600) |
|
03.0 Boronyi |
|
|
|
|
|
|
|
|
|
|
|
|
|
|
|
|
|
|
|
|
|
2700 |
70 |
2 |
0 |
10 |
6 |
3000 |
2 |
600 |
|
|
1350 |
35 |
1 |
0 |
6 |
3 |
1800 |
1 |
300 |
|
|
1409 |
40 |
1 |
0 |
5 |
3 |
1500 |
3 |
900 |
|
|
|
(5459) |
(145) |
(4) |
(0) |
(21) |
(12) |
(6300) |
(6) |
(1800) |
|
04.0 Masongo |
|
|
|
|
|
|
|
|
|
|
|
|
|
|
|
|
|
|
|
|
|
2500 |
65 |
2 |
0 |
11 |
6 |
3300 |
1 |
300 |
|
|
874 |
25 |
1 |
0 |
4 |
3 |
1200 |
4 |
1200 |
|
|
2100 |
55 |
1 |
0 |
8 |
3 |
2400 |
0 |
0 |
|
|
1812 |
50 |
1 |
0 |
7 |
3 |
2100 |
1 |
300 |
|
|
1200 |
35 |
1 |
0 |
5 |
3 |
1500 |
1 |
300 |
|
|
1100 |
30 |
1 |
0 |
4 |
3 |
1200 |
2 |
600 |
|
|
|
(9586) |
(260) |
(7) |
(0) |
(39) |
(21) |
(11700) |
(9) |
(2700) |
|
05.0 Kegati |
|
|
|
|
|
|
|
|
|
|
|
|
|
|
|
|
|
|
|
|
|
917 |
30 |
1 |
0 |
3 |
3 |
900 |
2 |
600 |
|
|
2000 |
55 |
2 |
0 |
8 |
6 |
2400 |
2 |
600 |
|
|
860 |
25 |
1 |
0 |
3 |
3 |
900 |
0 |
0 |
|
|
1350 |
40 |
1 |
0 |
5 |
3 |
1500 |
2 |
600 |
|
|
900 |
25 |
1 |
0 |
3 |
3 |
900 |
0 |
0 |
|
|
|
(6027) |
(175) |
(6) |
(0) |
(22) |
(18) |
(6600) |
(6) |
(1800) |
|
06.0 Nyamemiso |
|
|
|
|
|
|
|
|
|
|
|
|
|
|
|
|
|
|
|
|
|
820 |
30 |
1 |
0 |
2 |
3 |
600 |
3 |
900 |
|
|
1800 |
45 |
2 |
0 |
6 |
6 |
1800 |
0 |
0 |
|
|
1200 |
35 |
1 |
0 |
5 |
3 |
1500 |
1 |
300 |
|
|
|
(3820) |
(110) |
(4) |
(0) |
(13) |
(12) |
(3900) |
(4) |
(1200) |
|
07.0 Nyanguru |
|
|
|
|
|
|
|
|
|
|
|
|
|
|
|
|
|
|
|
|
|
3000 |
85 |
2 |
0 |
12 |
6 |
3600 |
2 |
600 |
|
|
1116 |
30 |
1 |
0 |
4 |
3 |
1200 |
2 |
600 |
|
|
1200 |
30 |
1 |
0 |
4 |
3 |
1200 |
0 |
0 |
|
|
2700 |
75 |
2 |
0 |
10 |
6 |
3000 |
4 |
1200 |
|
|
|
(8016) |
(220) |
(6) |
(0) |
(30) |
(18) |
(9000) |
(8) |
(2400) |
|
08.0 Bobaracho |
|
|
|
|
|
|
|
|
|
|
|
|
|
|
|
|
|
|
|
|
|
489 |
15 |
1 |
0 |
2 |
1 |
600 |
0 |
0 |
|
|
3000 |
80 |
2 |
0 |
12 |
6 |
3600 |
2 |
600 |
|
|
2000 |
50 |
1 |
0 |
8 |
3 |
2400 |
0 |
0 |
|
|
1513 |
50 |
2 |
0 |
4 |
6 |
1200 |
6 |
1800 |
|
|
670 |
20 |
1 |
0 |
2 |
3 |
600 |
0 |
0 |
|
|
|
(7672) |
(215) |
(7) |
(0) |
(28) |
(19) |
(8400) |
(8) |
(2400) |
|
09.0 Nyaura |
|
|
|
|
|
|
|
|
|
|
|
|
|
|
|
|
|
|
|
|
|
1716 |
50 |
2 |
0 |
7 |
6 |
2100 |
7 |
2100 |
|
|
2120 |
55 |
2 |
0 |
8 |
6 |
2400 |
2 |
600 |
|
|
870 |
25 |
1 |
0 |
3 |
3 |
900 |
1 |
300 |
|
|
450 |
15 |
1 |
0 |
2 |
3 |
600 |
1 |
300 |
|
|
1650 |
45 |
1 |
0 |
7 |
3 |
2100 |
0 |
0 |
|
|
3000 |
80 |
2 |
0 |
11 |
6 |
3300 |
1 |
300 |
|
|
2500 |
65 |
2 |
0 |
8 |
6 |
2400 |
2 |
600 |
|
|
520 |
15 |
1 |
0 |
2 |
3 |
600 |
0 |
0 |
|
|
867 |
25 |
1 |
0 |
3 |
3 |
900 |
0 |
0 |
|
|
|
(13693) |
(375) |
(13) |
(0) |
(51) |
(39) |
(15300) |
(14) |
(4200) |
|
10.0 Nyanchwa |
|
|
|
|
|
|
|
|
|
|
|
|
|
|
|
|
|
|
|
|
|
3000 |
85 |
2 |
0 |
10 |
6 |
3000 |
4 |
1200 |
|
|
920 |
25 |
1 |
0 |
4 |
3 |
1200 |
0 |
0 |
|
|
2299 |
60 |
2 |
0 |
10 |
6 |
3000 |
0 |
0 |
|
|
1450 |
40 |
1 |
0 |
5 |
3 |
1500 |
1 |
300 |
|
|
|
(7669) |
(210) |
(6) |
(0) |
(29) |
(18) |
(8700) |
(5) |
(1500) |
|
11.0 Township |
|
|
|
|
|
|
|
|
|
|
|
|
|
|
|
|
|
|
|
|
|
1402 |
40 |
1 |
0 |
6 |
3 |
1800 |
0 |
0 |
|
|
680 |
20 |
1 |
0 |
2 |
3 |
600 |
1 |
300 |
|
|
1320 |
35 |
1 |
0 |
5 |
5 |
1500 |
0 |
0 |
|
|
2800 |
70 |
2 |
0 |
12 |
6 |
3600 |
0 |
0 |
|
|
1880 |
50 |
1 |
0 |
6 |
3 |
1800 |
2 |
600 |
|
|
318 |
10 |
1 |
0 |
1 |
3 |
300 |
1 |
300 |
|
|
|
(8400) |
(225) |
(7) |
(0) |
(32) |
(23) |
(9600) |
(4) |
(1200) |
|
|
|
|
|
|
|
|
|
|
|
|
Totals |
77772 |
2140 |
66 |
0 |
297 |
198 |
89100 |
71 |
21300 |
|
|
|
|
|
|
|
|
|
|
|
Basic information for drinking water supply (example):
Inhabitants : 77772 (assumed 80.000)
Boreholes : 6
Approximately litres/day 2.140.000 (
Solar pumps installed : 368
Installed photovoltaic power : 110.4 KW
15 m3 water tanks :368
Back-up hand pumps : 198 being 66 triple sets.
Pipelines from boreholes to water tanks
(estimation) : 200000m.
More information :
Principles applied for placing drinking water structures
Boreholes and wells and their equipment
Water points near family homes
Some budget items applicable to
the water supply structures
Next
file:
Last file:
Back: 07.70
Financial sources sheet for funding applications.
Complete
index of the project.